Consolidation Among U.S. Commercial Banks

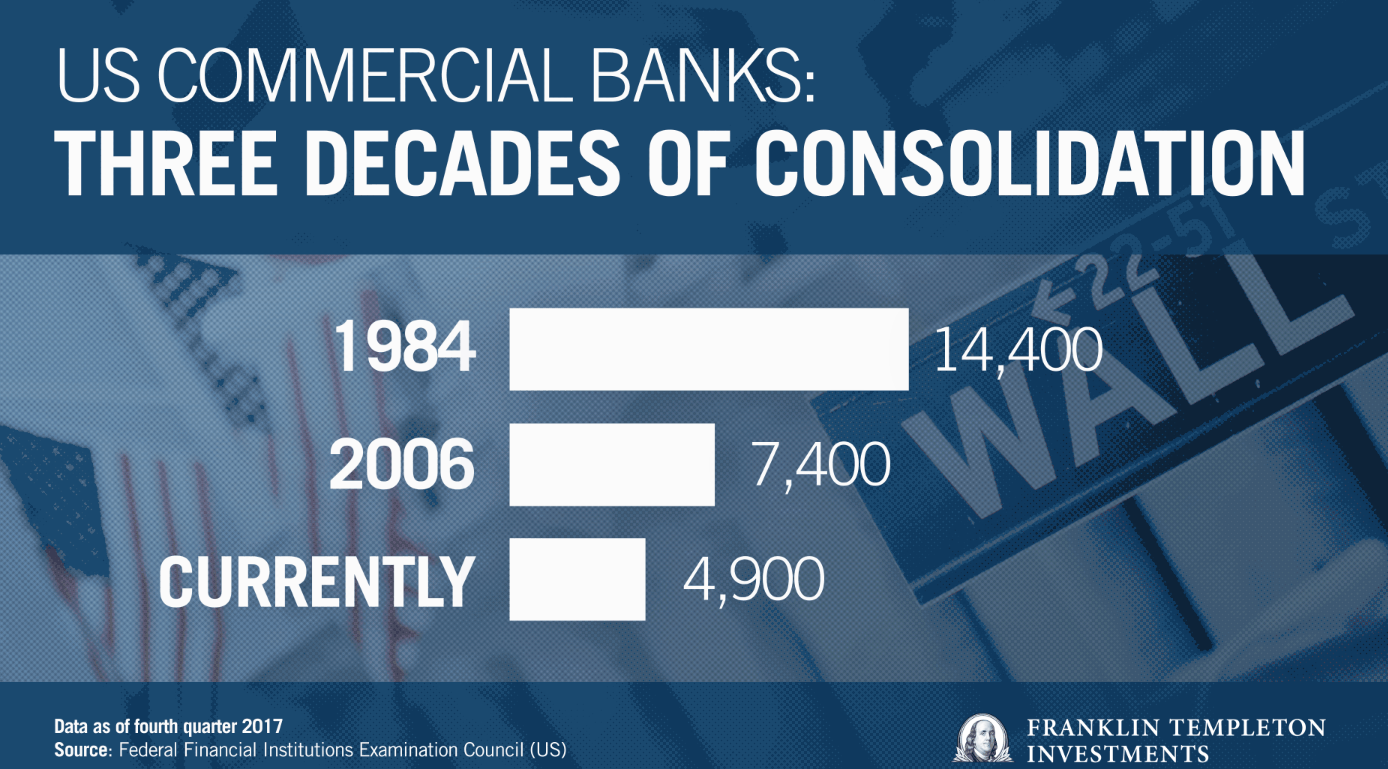
Consolidation in the U.S. commercial banking sector has led to a substantial declines in the number of banks available for banking. According to the Federal Reserve Federal Reserve Bank of St. Louis Economic Research report titled “Commercial Banks in the US.” the number of banks has fallen to 4,900 current. That is a decline of 66% from 1984.

Shawn Lyons, CFA of Franklin Templeton Investments posted an interesting article yesterday on the US banking industry. From the article:

We live in a digital world. Customers have a lot of alternatives to traditional banking. In the United States, there are nearly 5,000 banks.That’s a far cry from the 14,000 or so we had in 1984, and the 7,000 or so we had pre-GFC. But what that does tell us is that we’ve had robust merger-and-acquisition (M&A) activity in the banking industry for quite some time.

M&A does present challenges from a technology standpoint. When you merge two old institutions, the legacy technology usually gets a band-aid to make a square peg fit into a round hole so to speak. You can merge two banks and slap new signage on the buildings, but it’s what’s behind the storefront that is key.

By and large, US banks haven’t traditionally been innovators. Many have technology that is still in the mainframe era, not in the cloud era. So, a lot of these new financial technology (fintech) companies have an advantage in that they can be in real time—their systems can immediately talk to each other. Traditional banks are spending an enormous amount on technology as this area is both a challenge and tremendous  opportunity.

Banks have also faced a regulatory burden. However, the trajectory of that burden seems to be reversing (or at least stabilizing) under the new US administration. Banks should now have more money freed up to spend on technology, including competitive types of payment platforms. There are a number of things banks are trying to do with cloud-based technology and transacting in real time. I think fintech is pushing and pulling traditional banks to innovate and to compete.

Source: Banking Sector Under the Microscope,  Franklin Templeton Investments, March 20, 2018

The entire piece is worth a read.

On The Impact Of Dividend Reinvest On Annual Returns

Reinvesting dividends can boost returns especially in the long-term due to the effect of compounding. One of the simplest and easiest ways for investors to earn higher returns is signing up for automatic dividend reinvestment. Unless one needs the cash for some other investment or one lives off of dividend income, reinvesting dividends is a smart strategy.

The difference in annual returns with reinvesting dividends and excluding dividends varies across major markets as shown in the table below:

Click to enlarge

Note: The returns shown above are based on historical data for the past 25 years.

Source: How reinvesting dividends has affected returns over 25 years by David Brett, Schroders

In the US dividend reinvestment increases annual returns by 2.4%. In high dividend yield markets such as the UK, the difference in annual returns is a staggering 3.7%.


U.S. Small Bank Failures in the Past 15 Years: Chart

Small cap banks in the US provide a vital function to the economy. They offer loans to about 44% of farms, 50% of small businesses and 15% of all residential mortgages. When the Dodd-Frank Act was signed into law in 2010 in response to the Global Financial Crisis(GFC) small banks were hurt more than their large and medium peers. In fact, at the height of the crisis in 2009 and 2010, every week some bank collapsed. Usually these negative stories were released on Friday evenings in order to lessen media publicity and attention of the general public.

The chart below shows the yearly failures of US small cap banks in the past 15 years:

Click to enlarge

Note: A small cap banks are defined as banks with assets of $10 billion or less.

Source:With Rollback, Dodd-Frank Is Now Officially a Dud, US Funds

Performance of Gold vs. Other Asset Classes: Chart

Gold is an important asset to own. During times of capital market contractions gold can act as a cushion and help protect a portfolio from severe declines.

The following chart shows the performance of gold over other asset classes in different time periods:

Click to enlarge

Source: The Many Uses of Gold, US Funds

Related ETF:

  • SPDR Gold Shares ETF (GLD)

Disclosure: No Positions

The Current vs. Past Bull Market Returns: Chart

The current bull market started from the trough of the Global Financial Crisis(GFC) in early 2009. Despite being called a bull market it does not feel like a typical bull market. In fact, experts have dubbed this bull as the “most hated bull market in history”.

The chart below compares the returns of the current bull market against past bull markets:

Click to enlarge


Source: The Historic Bull Market Faces Off Against Steel Tariffs, US Funds