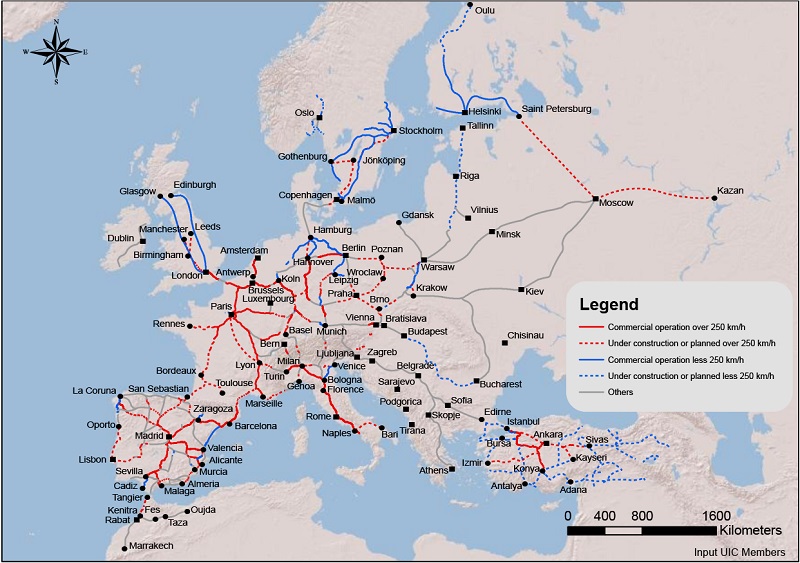
The latest high-speed rail network map of Europe is shown in the map below:
Click to enlarge
The high-speed rail network map of European Union is shown in the map below:
Click to enlarge
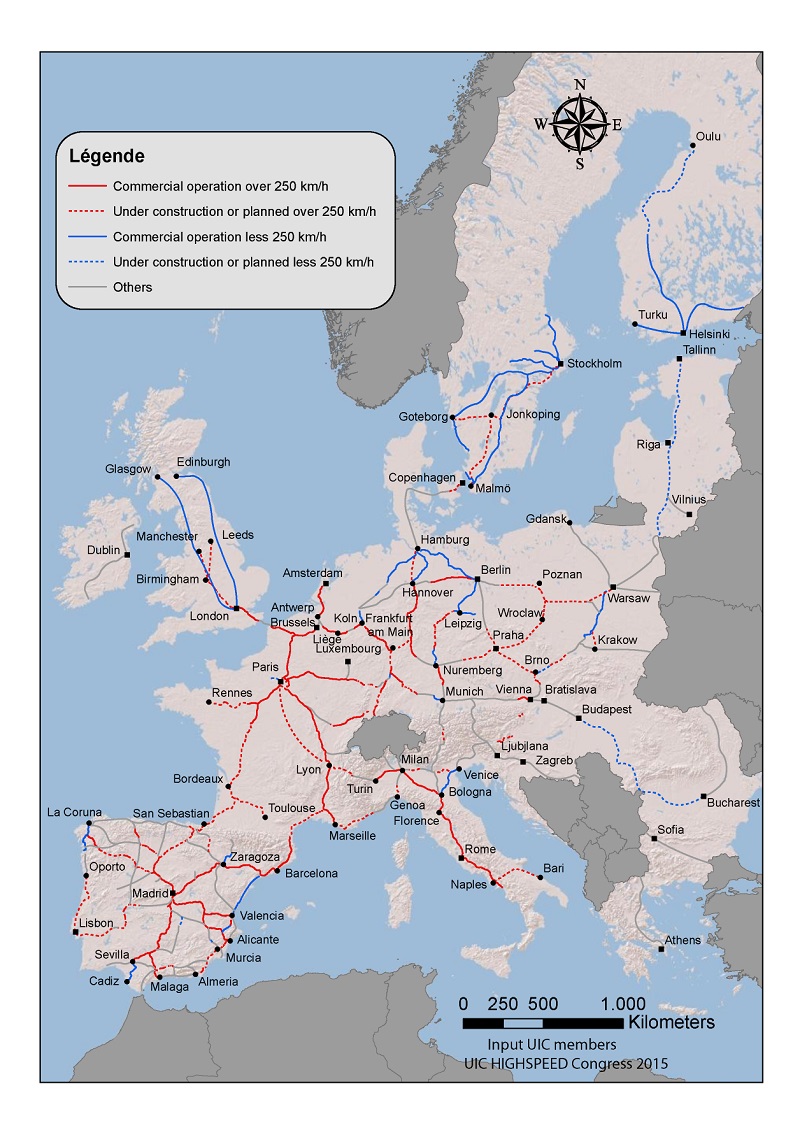
Source: UIC
As the maps show many of the major European cities are already connected by high-speed rail. With many lines under construction and planned for future development, passengers will be able to travel between most European cities quickly and efficiently in the future.