Emerging equity markets outperformed developed markets until a few years ago. Since then emerging equities have lost their shine and now their developed peers are outperforming them as the chart below shows:
Click to enlarge
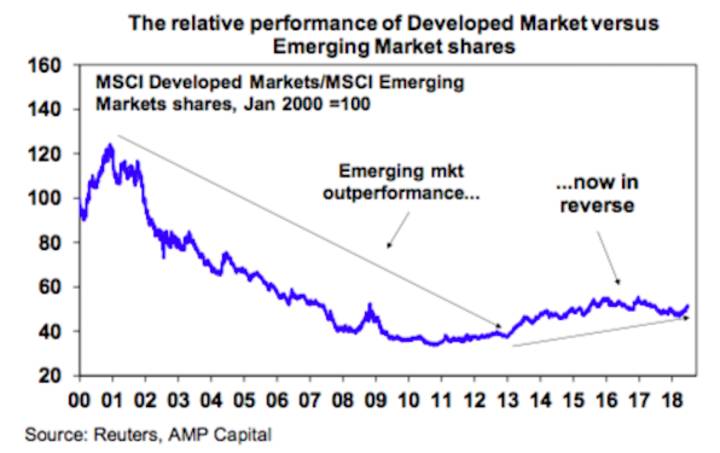
Source: Econosights – Should we worry about emerging markets?, AMP Capital