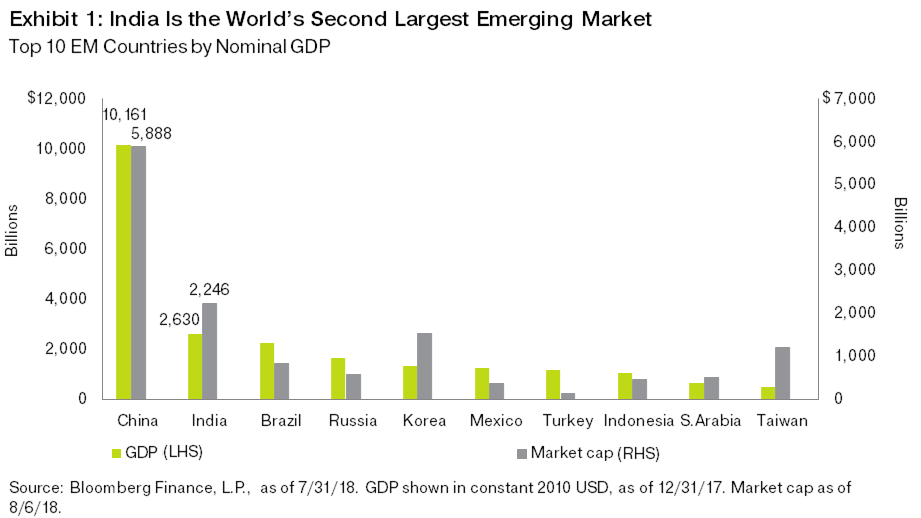
The Top 10 Emerging Market Economies by Nominal GDP is shown in the graph below. China is the world’s largest emerging market followed by India.
Click to enlarge
Source: India Is NOT the Next China, Oppenheimer Funds
The Top 10 Emerging Market Economies by Nominal GDP is shown in the graph below. China is the world’s largest emerging market followed by India.
Click to enlarge
Source: India Is NOT the Next China, Oppenheimer Funds
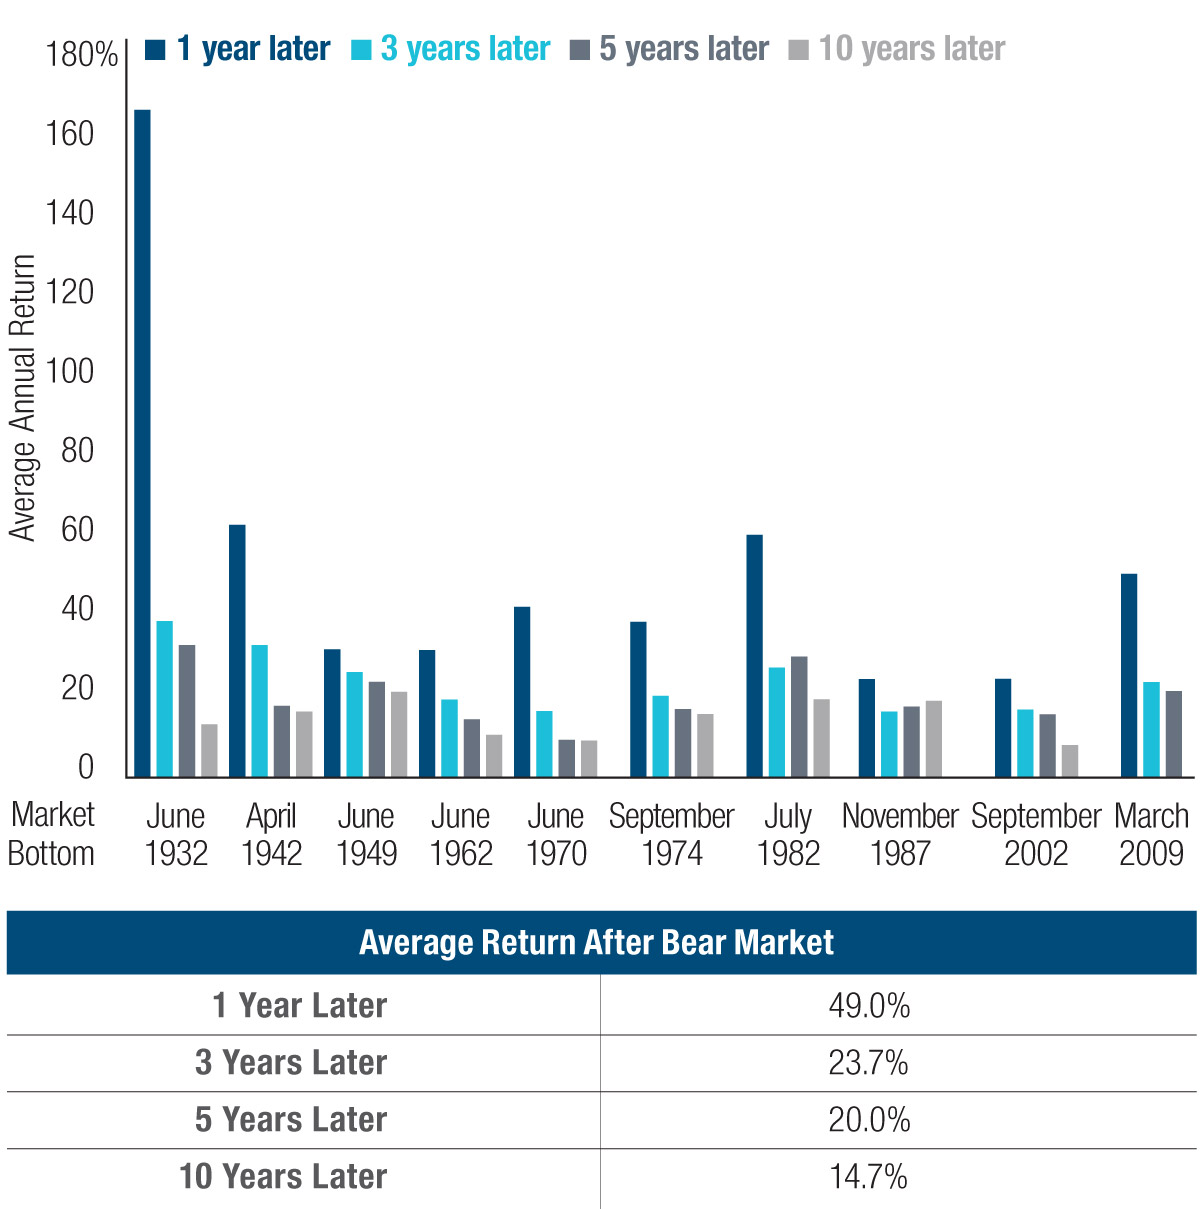
U.S. stocks have historically yielded strong returns in the years following bear markets. Since 1926, the average duration of bull market has been 82 months while that of the bear market has been just 23 months according to an article at T.Rowe Price. To put another way, bull markets last four times as long as bear markets.
Click to enlarge
Source: The Power of the Bull, T.Rowe Price
Market timing is extremely hard and is not a wise strategy for most investors. Equity markets decline and rise for all types of reasons and with no warning. In addition, the falls can be dramatic and shocking within a short period of time but equally dramatic are the violent gains that follow plunges. So the key to long-term investing success is to be patient and avoid getting caught in the chaos and selling out with the hope of buying back at a cheaper price later. Even though markets can fall in any given year, intra-year declines tend to be overridden with gains yielding a net gain in most years. The above scenario is true with most markets.
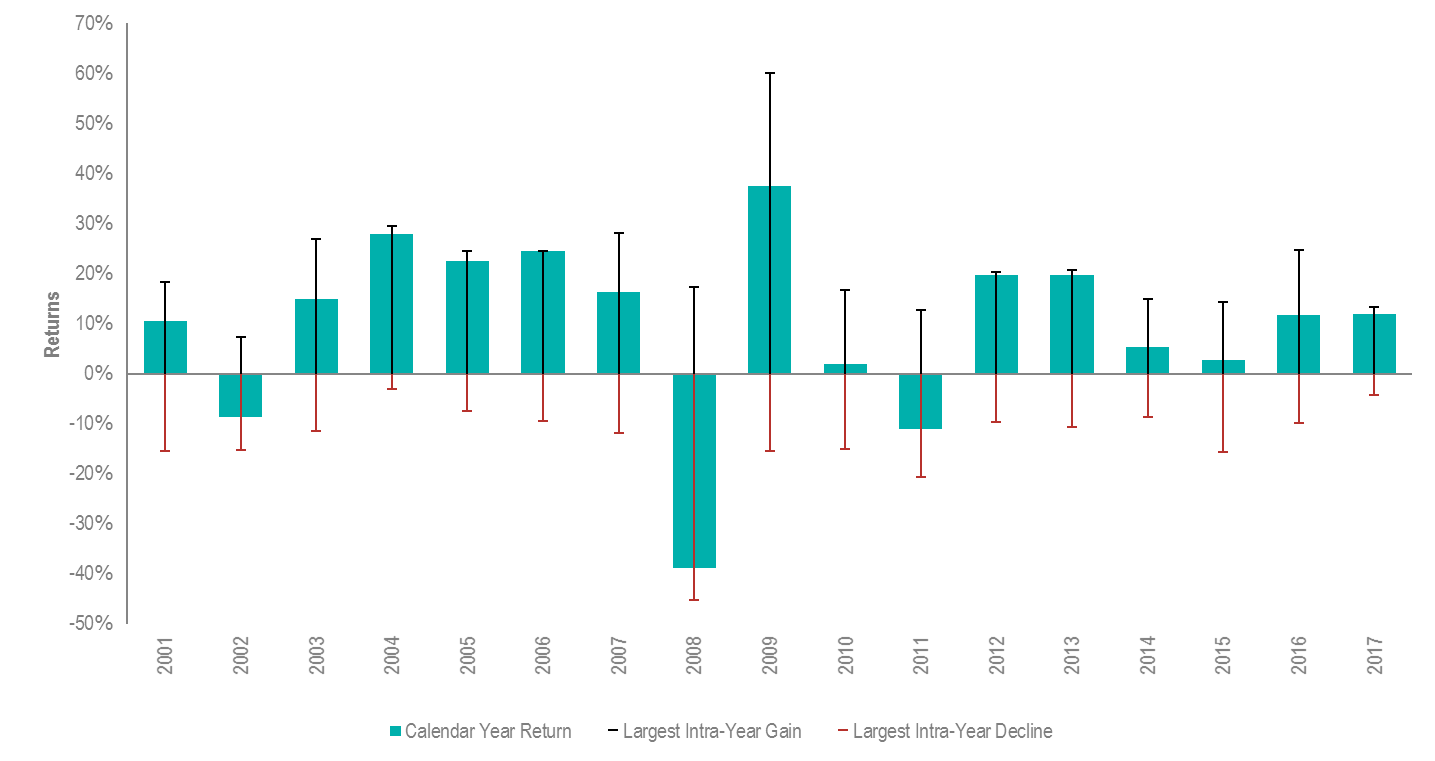
The following chart shows the Intra-Year Gains and Declines vs. Calendar Year Returns from 2001 to 2017 for the Australian stock market:
Click to enlarge
Source: VOLATILITY – 8 SIMPLE LESSONS, Stewart Partners
From the article:
Market timing is hard.
Recoveries can come just as quickly and just as violently as the prior correction. In 2008, the Australian share market fell by nearly 40%. Some investors capitulated, only to see the market bounce by more than 37% in 2009 and rise in seven of the eight subsequent years. The lesson is that attempts at market timing risk turning paper losses into real ones and paying for the risk without waiting around for the recovery.
The graph below shows calendar year returns for the Australian stockmarket since 2001, as well as the largest intra-year falls that occurred each year. During this 17 year period, the average intra-year decline was 13%. About 60% of the years observed had falls of more than 10%, and about 40% had falls of more than 15%. But despite substantial intra-year falls, calendar year returns were positive in 14 out of the 17 years examined.
Related ETF:
Disclosure: No Positions
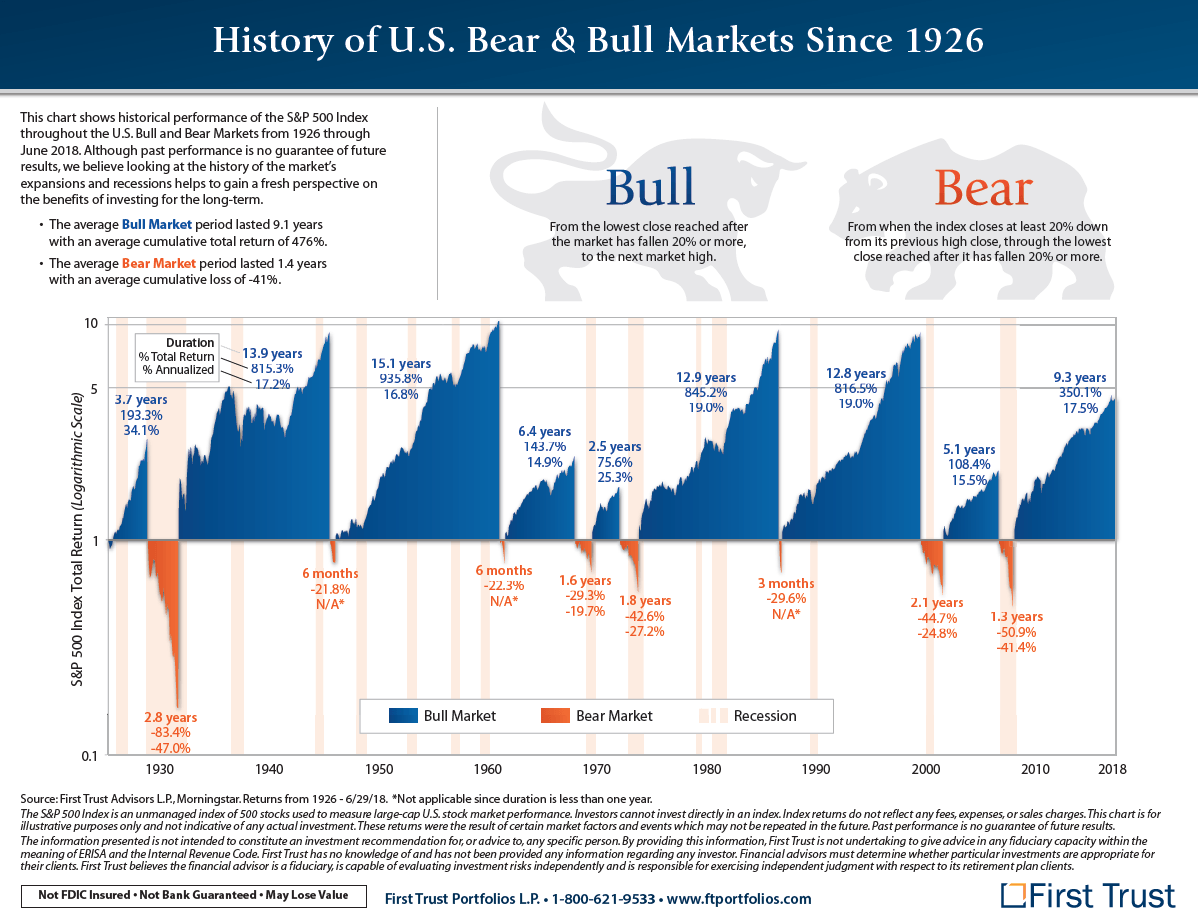
The bull market in U.S. equities since the Global Financial Crisis(GFC) seemingly remains strong despite many crises affecting the US and global economy in recent years. The most recent Turkey crisis has become another “dead on arrival” case. The question now on most investors’ mind is what is holding up US stocks so well and when will the bull get tired. Though nobody including the so-called experts knows exactly when this bull market will end, it helps to pay attention to historical performances of bull and bear markets.
I came across the following historical US bull and bear markets chart created by First Trust and posted by Barry Ritholtz at The Big Picture:
Click to enlarge
Source: First Trust
The Top 10 Global Banks by Assets for 2018 is shown in the chart below. According to the Bloomberg article 9 out of the top 10 banks were Japanese in 1988 before the Nikkei collapsed Before the Global Financial Crisis of 2008, the list was dominated by US and European banks. After the crisis most of these developed banks crashed and would not exist today if they were not bailed out by the states. European banks especially were the hardest hit and never recovered due to incompetent managements, political paralysis, dithering regulators and politicians. The banking crisis shows that when a crisis hits, Americans are better in handling and fixing it than the Europeans. Sometimes one has to wonder if all those European bankers know even how to run a mom-and-pop grocery store in a third-world country let alone a complex operation like a bank.
Click to enlarge
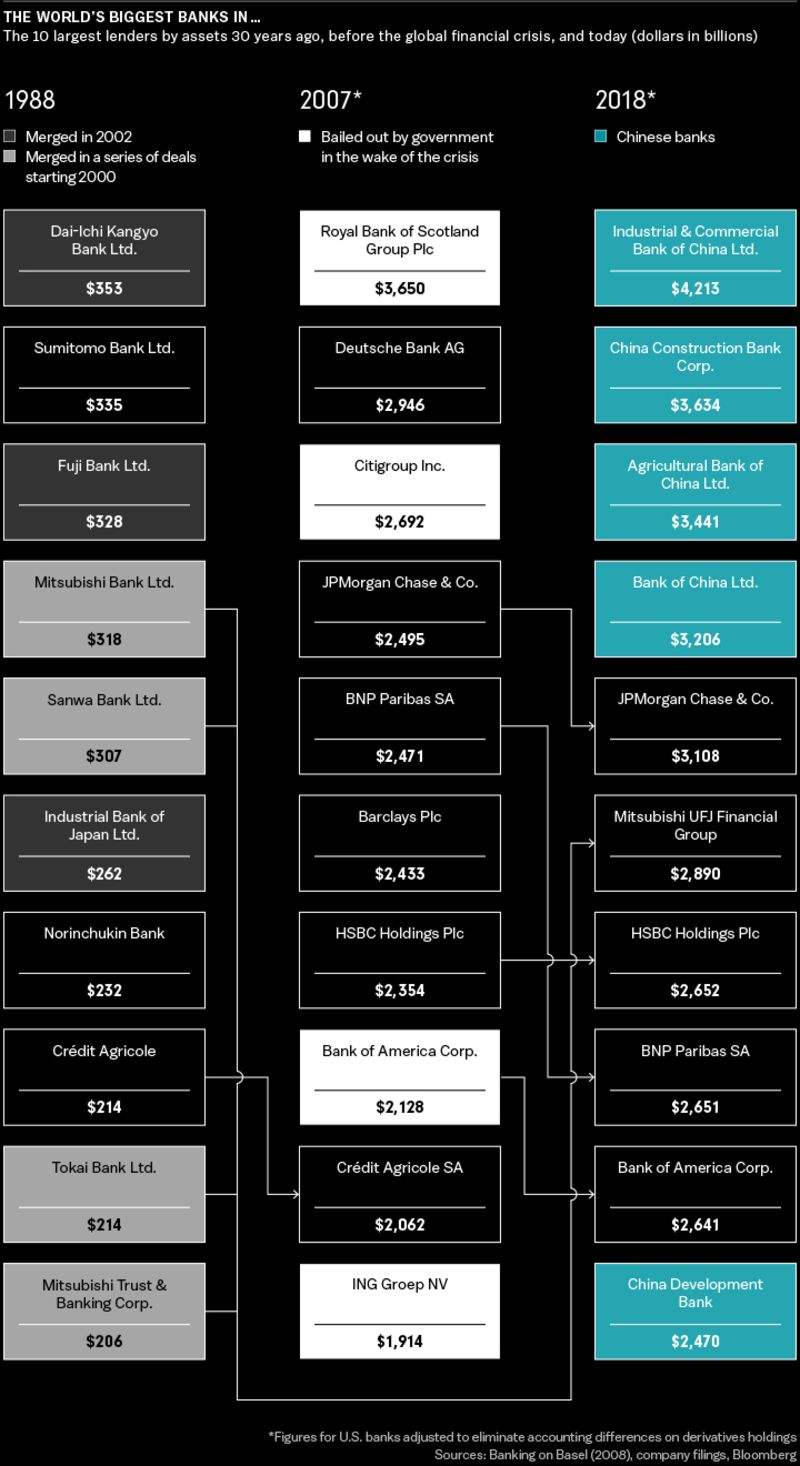
Source: China’s Giant Banks Top This Ranking. And That’s a Cause for Concern, Bloomberg
Of the top 10, five are Chinese banks including all top 4. The only European bank is the French BNP Paribas(BNPQY). UK-based HSBS(HSBC) is really an Asian bank with roots in Hong Kong.
Disclosure: No Positions