The media plays an important role in democracies. However bias in the media distorts their work. Some tend to have a right-wing agenda with the coverage while other lean towards the left. Some are neutral. A very few are extreme left or right basically spreading lies and fake news on a daily basis confusing the public.
In the US for example, The Wall Street Journal is a big supporter of President Trump and his policies while The New York Times and The Washington Post are the exact opposite.
I came across the following chart showing the various media outlets with their biases:
Click to enlarge
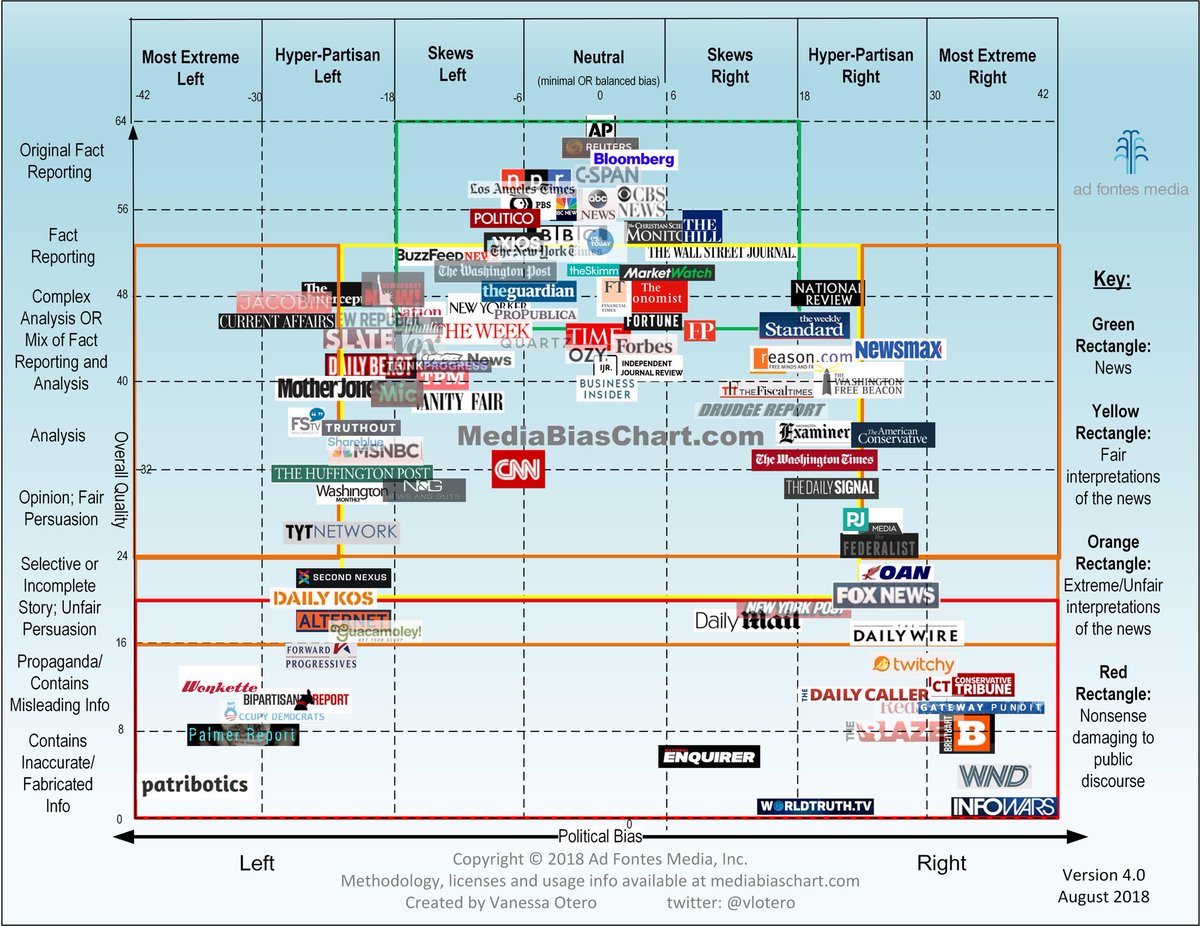
Source: adfontesmedia.com
Hat Tip: @Lelde Smits