The S&P Biotechnology Select Industry Index is one of the major indices that tracks the biotech sector. The index is up just 8% YTD while the NYSE Arca Biotechnology Index has shot up over 23%.
Click to enlarge
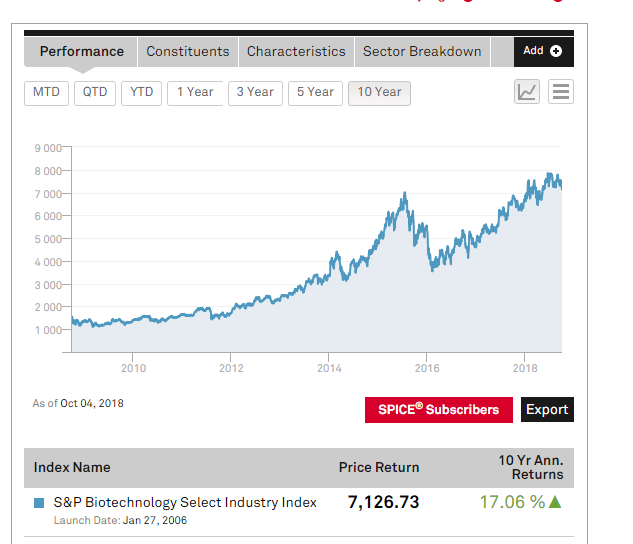
Source: S&P Indices
Overall Biotech stocks have performed so far well this year. Investors interested in the sector can check out the options available on the NASDAQ market.