The US equity market may end the year with a loss barring any Santa Claus rally or a miracle. So investors may be wondering if this is the start of a bear market. Bear market is usually defined as a decline of 20% or more. According to an article at Schwab, very few of corrections in the market have turned into bear markets. In fact, since 1974 only 4 have turned into bear markets.
From the article:
Is it the start of a bear market?
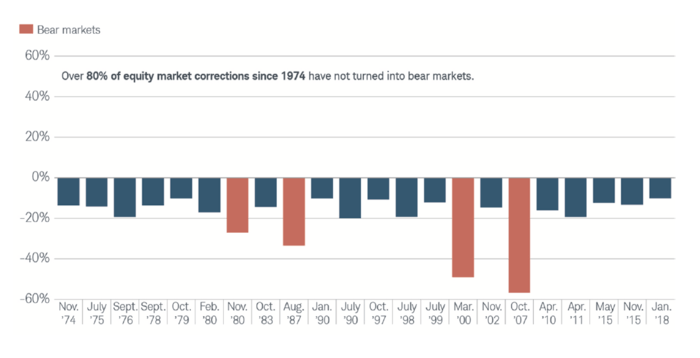
Nobody can predict with any degree of certainty whether a correction will reverse or turn into a bear market. However, historically most corrections haven’t become bear markets (that is, periods when the market falls by 20% or more). There have been 22 market corrections since November 1974, and only four of them became bear markets (which began in 1980, 1987, 2000 and 2007).
Since 1974, only four market corrections have become bear markets
Source: Schwab Center for Financial Research with data provided by Morningstar, Inc. Each period listed represents the beginning month/year of either a market correction or a bear market. The general definition of a market correction is a market decline that is more than 10%, but less than 20%. A bear market is usually defined as a decline of 20% or greater. The market is represented by the S&P 500 index. Past performance is no guarantee of future results.
Source: Market Correction: What Does It Mean?, Schwab
Updates:
- US Bull and Bear Markets From 1903 To 2016:
Click to enlarge
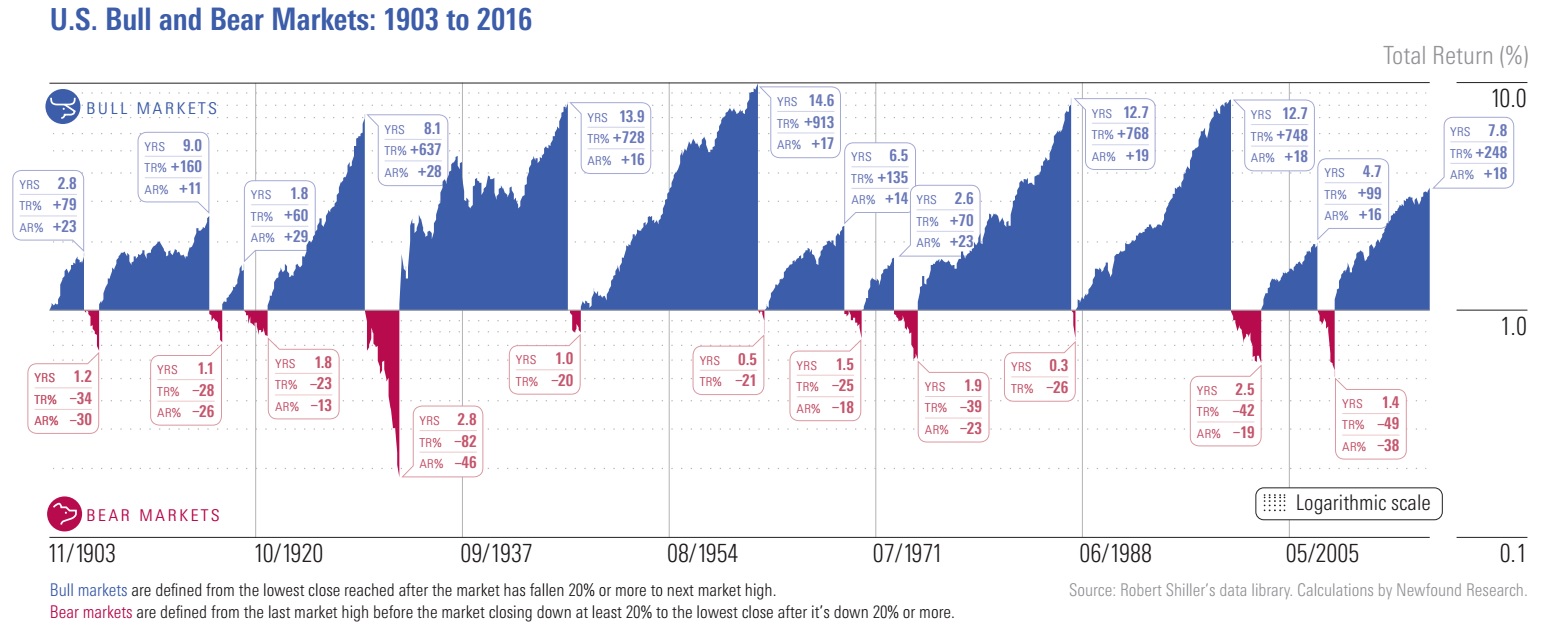
Source: Skloff Financial Group
According to Morningstar, over the period from 1903 to 2016, there were 12 bull markets in the S&P 500. The average bull market lasted 8.1 years, with a total return of 387%. The average bear market lasted 1.5 years, with a total loss of 35%. Hence bear markets are shorter than bull markets on an average.
2. History of US Bull and Bear Markets:
Click to enlarge
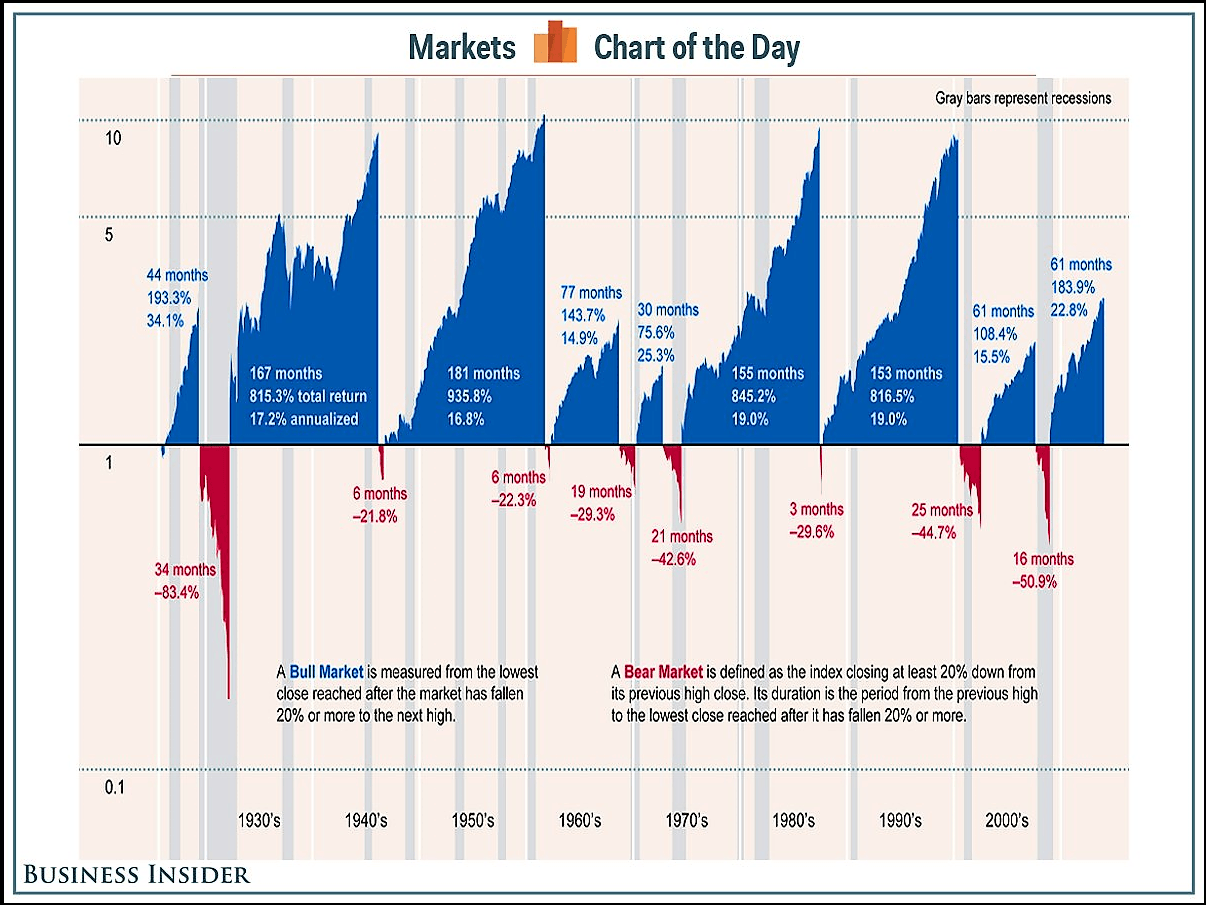
Source: Business Insider
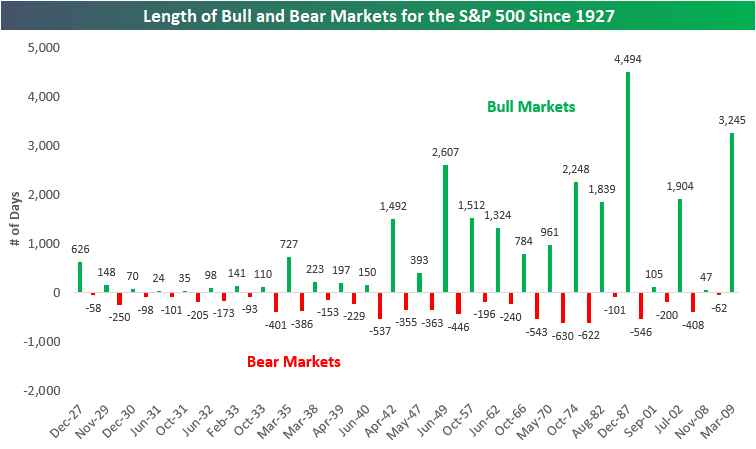
3a. Length of Bull and bear Markets for the S&P 500 since 1927:
Click to enlarge
3b.US Bull and Bear Market Cycles post World War 2 based on S&P 500:
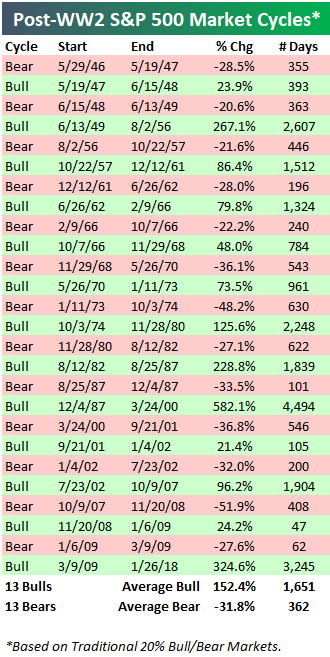
Source: Bespoke Investment Group
4.Dates of S&P 500 Bear Markets Since 1929:
Click to enlarge
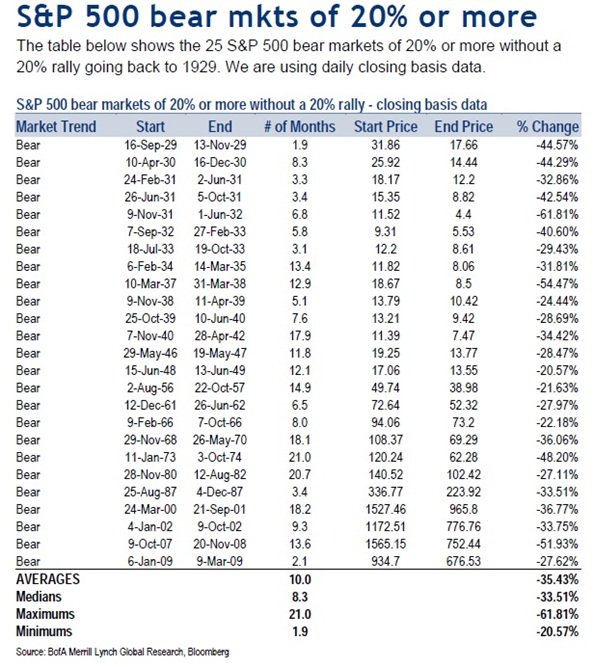
Source: Gold Eagle
Earlier Related Posts:
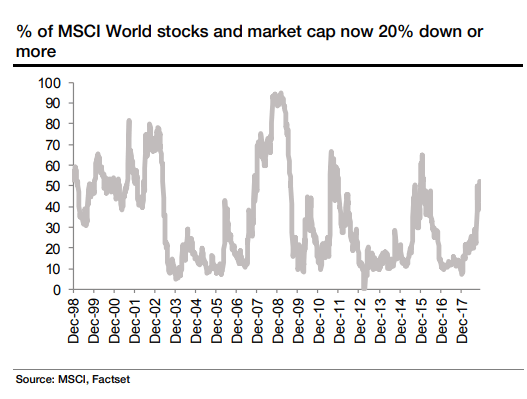
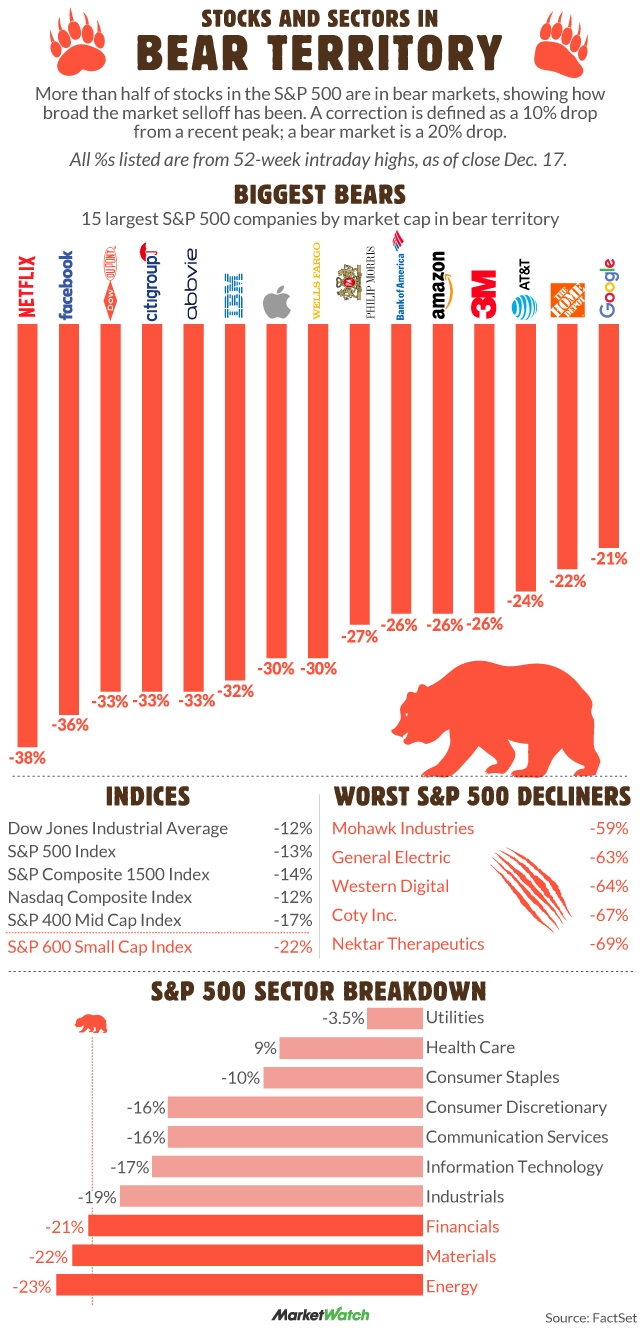
- Half of Global Stocks and S&P 500 Stocks Are Now in a Bear Market, Dec 19, 2018
- Stocks Deliver Strong Returns Following Bear Markets
- Average Annual U.S. Equity Returns Following Bear Markets: Chart
- On the Importance of Diversification During Bear Markets
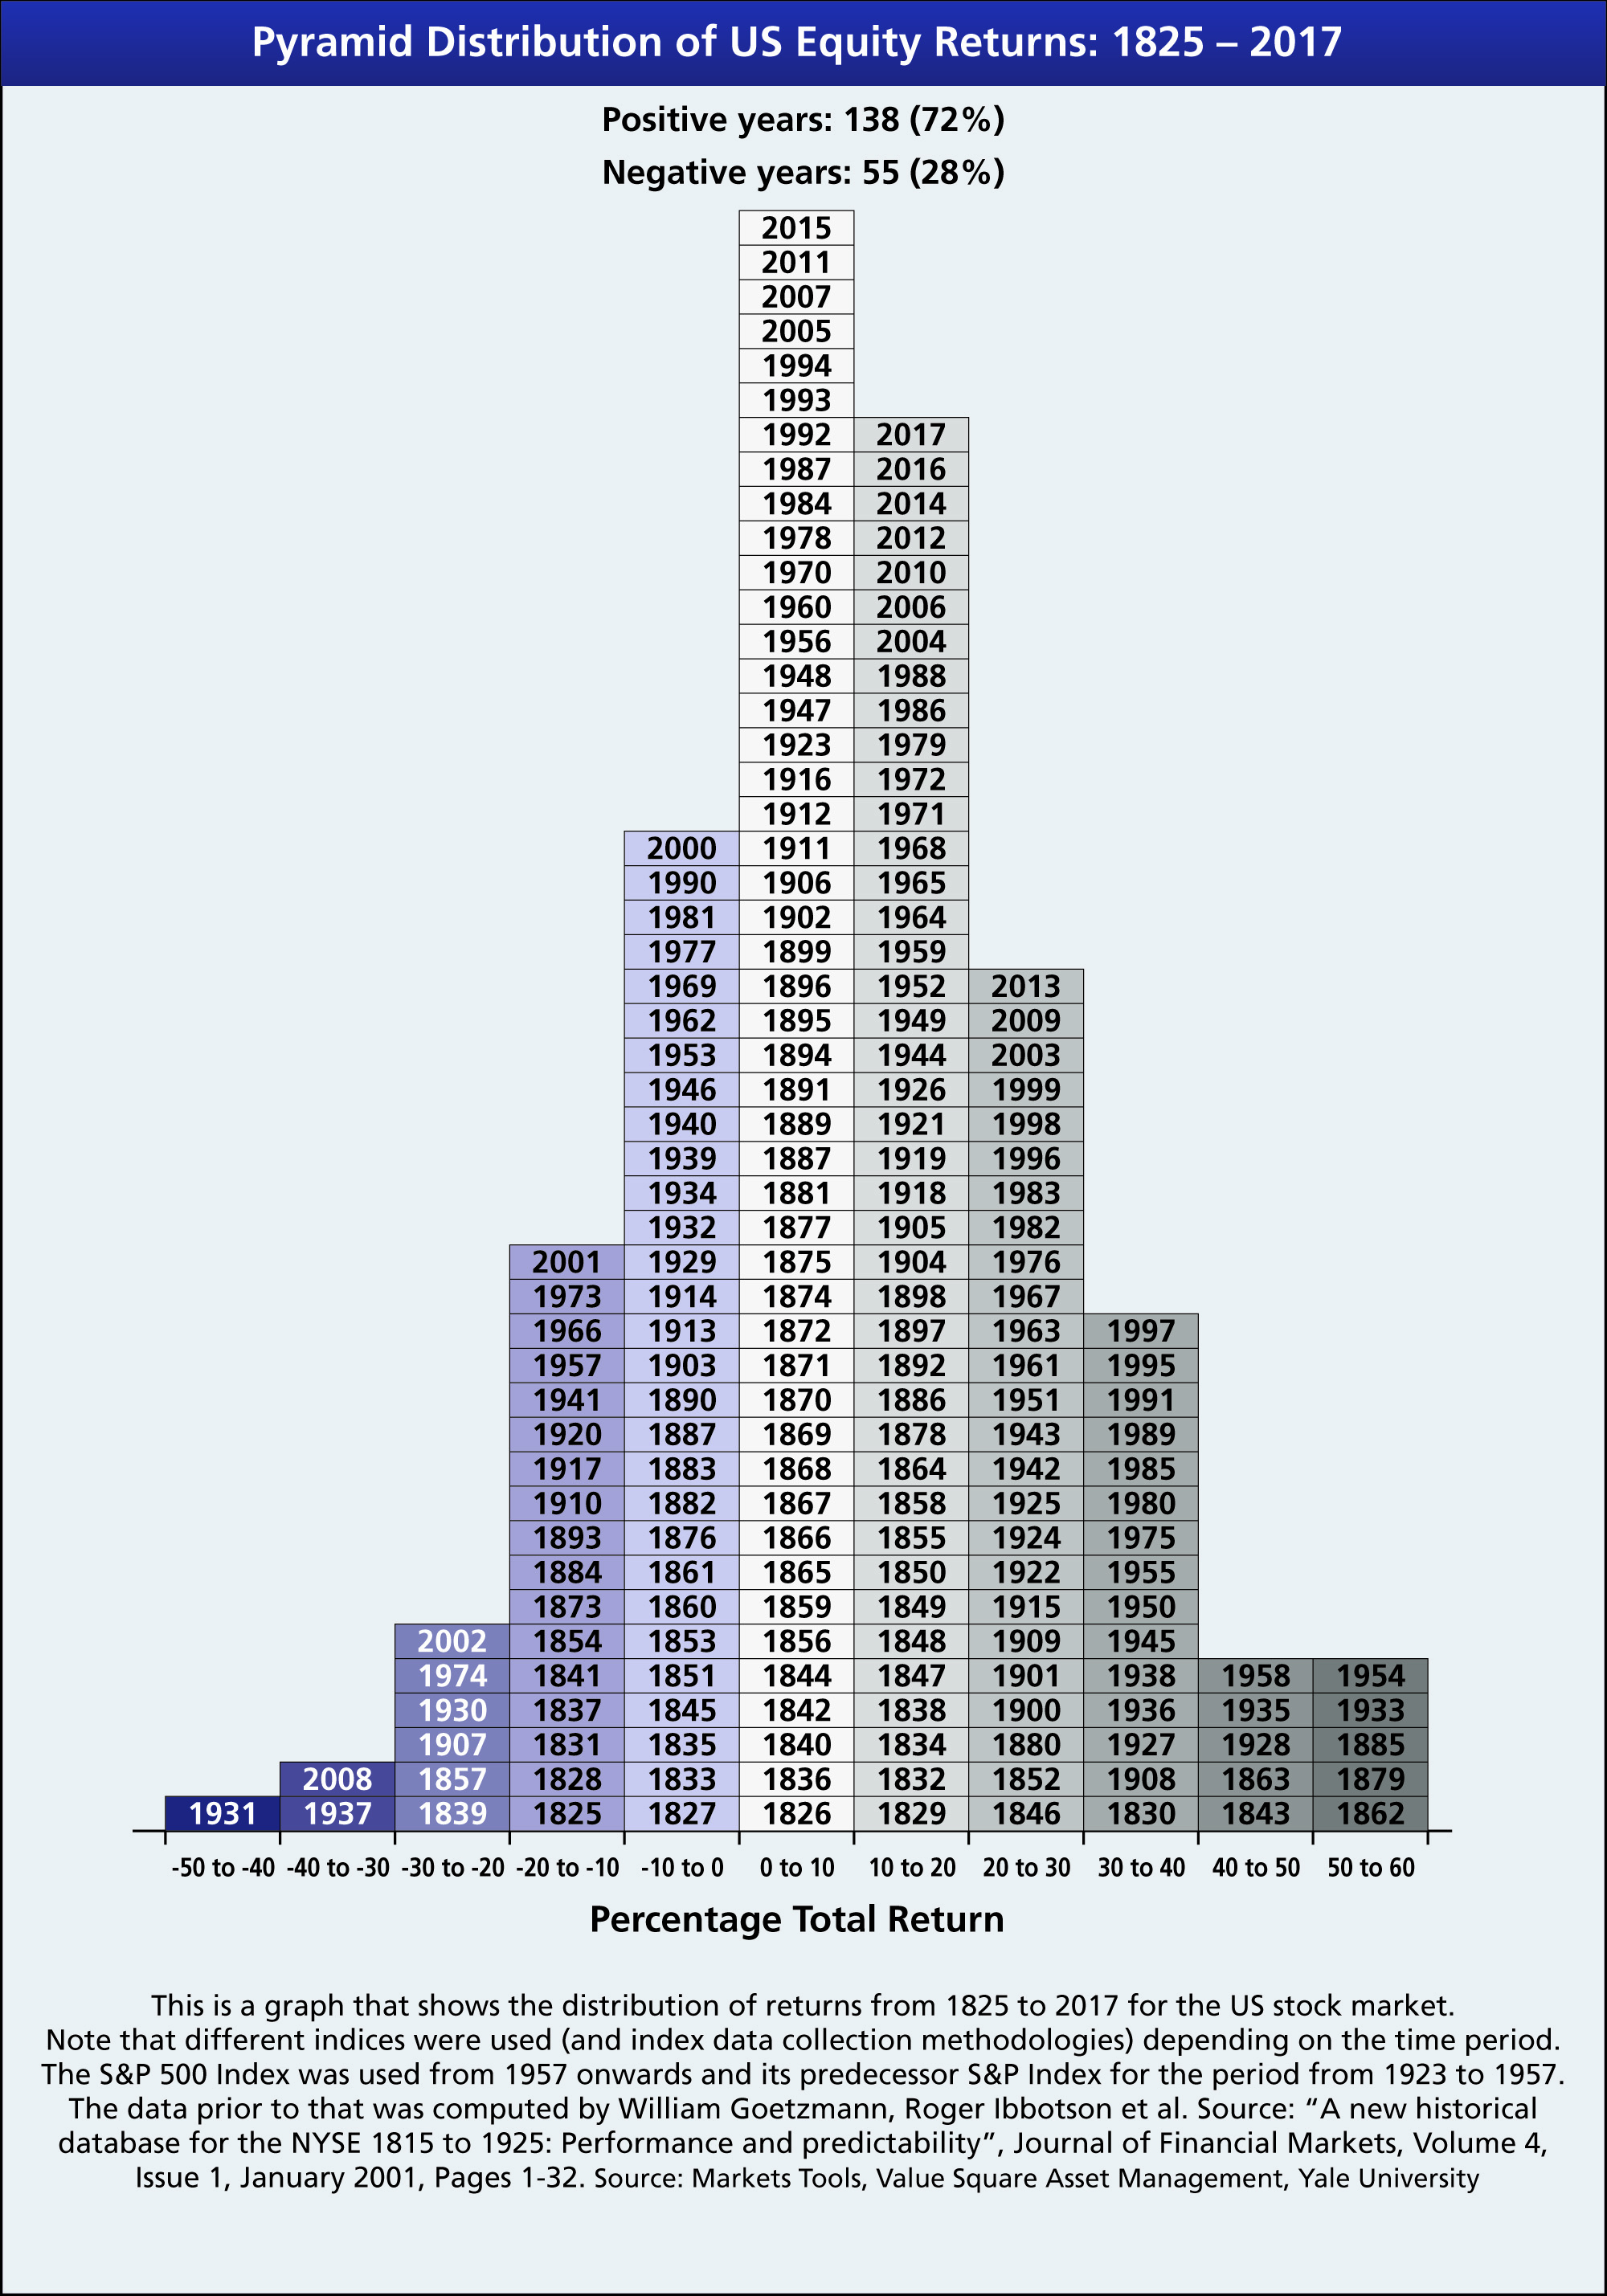
- Total Returns During US Equity Secular Bull and Bear Markets Since 1877
- WSJ: Bear Markets are Remarkably Short – Length of Bear Markets Since 1920s
- Bear Markets Are Always Followed By Positive Returns
- S&P 500: Bear and Bull Market Price Returns From 1966 To 2017
- Past Bull Markets Following Bear Markets: Chart
- Cyclical Bull Market in US Stocks Since World War II
Foreign Bear Markets: