The US Commercial Real Estate sector remains a risk despite despite investors’ hopes for a soft landing, according to an article by IMF posted last month. According to the Mortgage Bankers Association, some $1.5 Trillion of commercial real estate debt is maturing in the next two years. About one-fourth of this debt is in office and retail sectors. Most of this debt is held by banks and commercial mortgage-based securities. This is indeed a huge risk for the economy as whole. No wonder regional lenders are under tremendous pressure from CRE loans. The following an excerpt from the IMF piece:
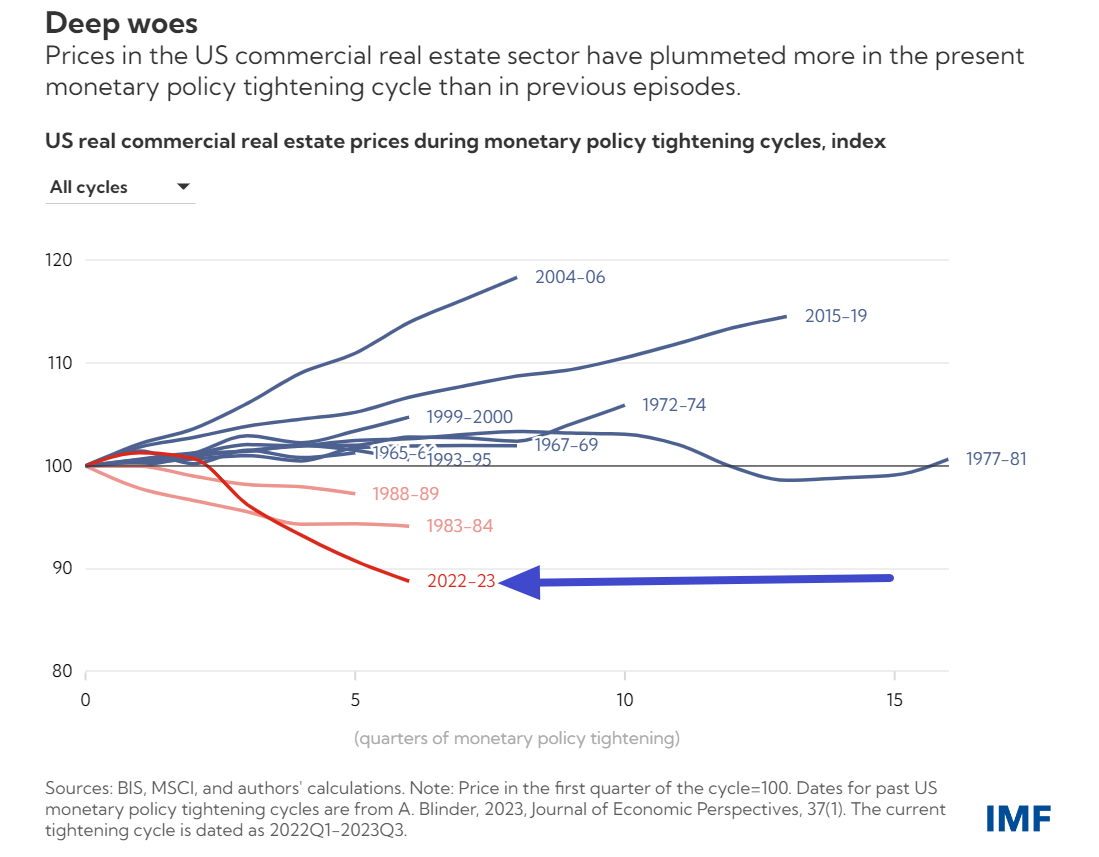
The commercial real estate sector has been under intense pressure globally as interest rates have risen over the past couple of years. In the United States, with the largest commercial property market in the world, prices have tumbled by 11 percent since the Federal Reserve started raising interest rates in March 2022, erasing the gains of the preceding two years.
Higher borrowing costs tend to dampen commercial property prices directly by making investments in the sector more expensive, but also indirectly by slowing economic activity and reducing the demand for such properties. Nevertheless, the sharp decline in prices during the current US monetary policy tightening cycle is striking. As the Chart of the Week shows, contrary to the current policy cycle, commercial property prices remained generally stable or saw milder losses during past Fed rate hikes. Some of the earlier rate hikes, though, such as in 2004-06, were subsequently followed by a recession during which commercial property prices recorded notable declines as demand fell.
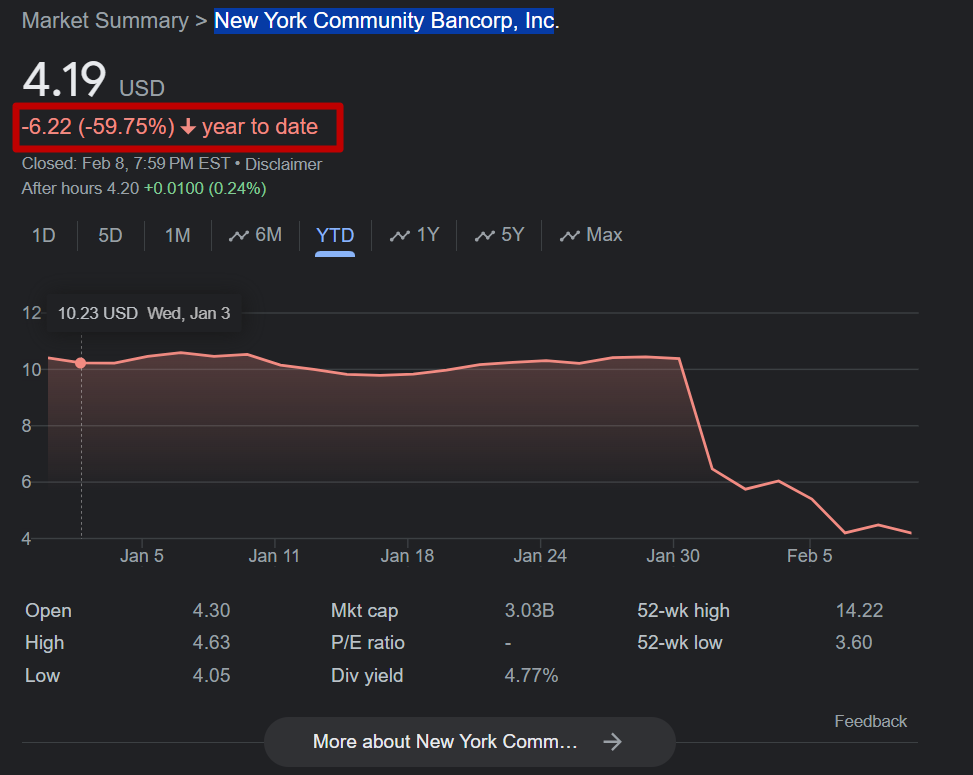
The recent plunge in New York Community Bancorp, Inc (NYCB) due to CRE loans and other factors is a cautionary tale for investors. Many regional and small lenders are on thin ice holding these loans and any declines in prices will further deteriorate their shaky balance sheets. Hence it is not wise to jump into these stocks at current levels. The following chart shows the dramatic decline in the stock price of NYCB year-to-date:
The Magnificent Seven have had a great run in recent years including last year. They continue to remain strong and some have shot up even further so far this year. For example, Meta Platforms (META) soared over 20% this past Friday after great 4th quarter earnings and the announcement of a dividend payment. Meta had a market cap of over $1.0 Trillion before this 20% jump. The rise of over $200 billion in market cap in a day is a record for any company in the US markets. The questions on some investors’ mind is this huge jump warranted.
Other mega caps have astonishing market caps as well with Apple (AAPL) at $2.87 Trillion and software giant Microsoft(MSFT) topping even that at over $3.0 Trillion. Similarly Amazon(AMZN), Alphabet(GOOGL), Nvidia(NVDA) and Tesla(TSLA) have huge market caps as well. With that said, let’s discuss on some of the challenges faced by these market champions and a few related articles in this post.
An excerpt from an article by Raheel Siddiqui at Neuberger Berman:
All the glitters may not keep turning to gold
The Mag 7’s achievements in 2023 notwithstanding, we fear these marquee stocks could face headwinds in the coming year.
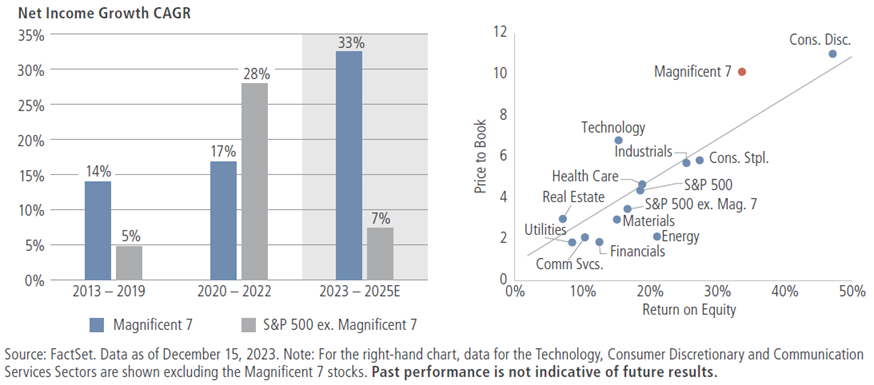
First, valuations appear precarious, in our view. Wall Street expects the Mag 7’s earnings and revenues to grow 33% and 17% per year, respectively, through 2025 (see the left chart in figure 3). Yet even considering the group’s relatively high returns on equity (shown on the right), the Mag 7 has the unnerving distinction of being the largest and most expensive grouping within the S&P 500. At current valuations, we believe this group—which now represents more than a quarter of the S&P 500—is roughly 60% more expensive on a P/E basis than the rest of the index, making them potentially vulnerable to even minor hiccups in the coming year.
Figure 3: The mag 7’s strong earnings expectations are commanding relatively rich valuations
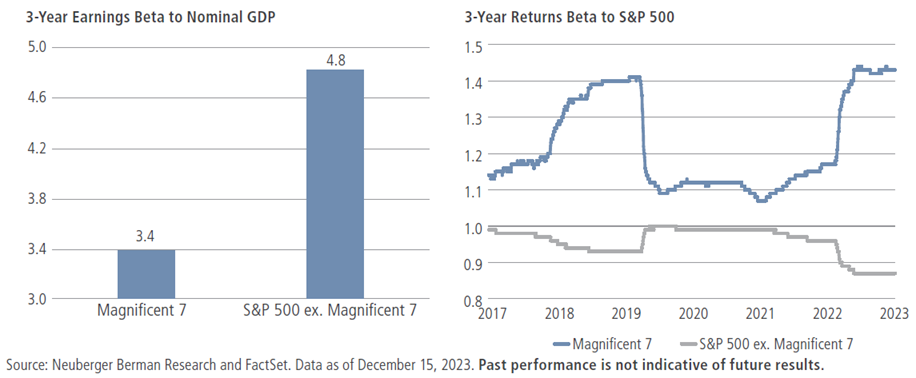
Second, the Mag 7 may prove more cyclical than investors seem to expect. These giants are often considered defensive businesses given that their products drive the relentless modernization of society, and that they also boast strong balance sheets and relatively high, stable profit margins. Indeed, over the last three years, the Mag 7’s earnings beta to nominal GDP has been 30% lower than the rest of the S&P 500 (see the left side of figure 4); however, the price beta of these stocks—at 1.4—was 50% higher than the rest of the S&P 500 (as shown the on right).
Figure 4: The Mag 7 may be less defensive than investors anticipate
Third, we believe the price returns of these seven stocks are highly correlated to each other—meaning that, from a portfolio perspective, owning them as a group is akin to inviting additional risk rather than diversifying away from it. Since 2017, the average pairwise correlation of the Mag 7 has been 55%—that’s 70% higher than for the rest of the 493 stocks.3 Furthermore, we find that correlation tends to rise during selloffs, which could make holding these stocks even riskier in a downturn.
Therefore—and despite some of their defensive characteristics—we fear that investors may have overlooked the inherent cyclicality and correlation of the mega-caps, potentially magnifying the investment risk should the Mag 7 begin to lose favour.
In addition he notes that these seven firms derive about half of their revenue from outside the US. Should the global economy go into contraction mode this will be problematic to their earnings.
And 2023 isn’t alone. Though 2022 was a break from the recent pattern, US index-tracking strategies have now beaten the combined wisdom of active investors for 8 out of the last 10 years. The scope and length of that remarkable run now eclipses even that of the dotcom boom.
Never before has following the crowd made so much money. Nor, in our estimation, so little sense. But just look at the opportunities the crowd has left for those of us willing to take a different view.
We could wax lyrical about the glaring difference in value between Korean banks priced at 4 times earnings, versus Apple at 28 times, despite diverging fundamentals—Apple is increasingly at risk of bans in China, while Korean banks could double their dividends.
Or how the thick margin of safety at Intel, backed by listed stakes and real saleable assets, compares to the slim margin for error at Nvidia, trading at 13 times next year’s projected revenue. That revenue that could be competed away over time, while Intel’s semiconductor “fabs” in the US are increasingly valuable as the east and the west drift further apart.
We could effuse about the quality of Nintendo’s innovation engine, and marvel at Mr Market’s willingness to extrapolate dominance for the Magnificent Seven while putting little value on Nintendo’s exceptional intellectual property.
But those deep dives would only cover a fraction of the portfolio, which risks diluting the message on how distorted the overall opportunity set has become.
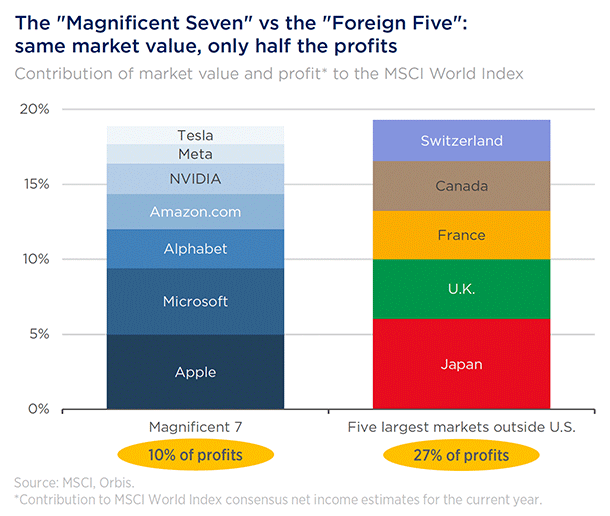
Not since the inception of the first Orbis Funds in 1990 has one country’s benchmark weight punched so far above its share of global GDP (then Japan, now the US). Nor since our sister company Allan Gray’s creation in 1973 have a handful of shares commanded such a large proportion of the market. Today, the Magnificent Seven stocks command as much market value as the “Foreign Five”, the largest developed stockmarkets outside the US by market value, yet the Seven contribute less than half the profits of those stockmarkets.
Niels Clemen Jensen at Absolute Return Partners, UK also wrote in the latest edition of The Absolute Return Letter that the mega caps are expensive and they have made the US market also expensive in terms of valuations.
It remains to be see how the rest of the year turns out for the magnificent seven stocks.
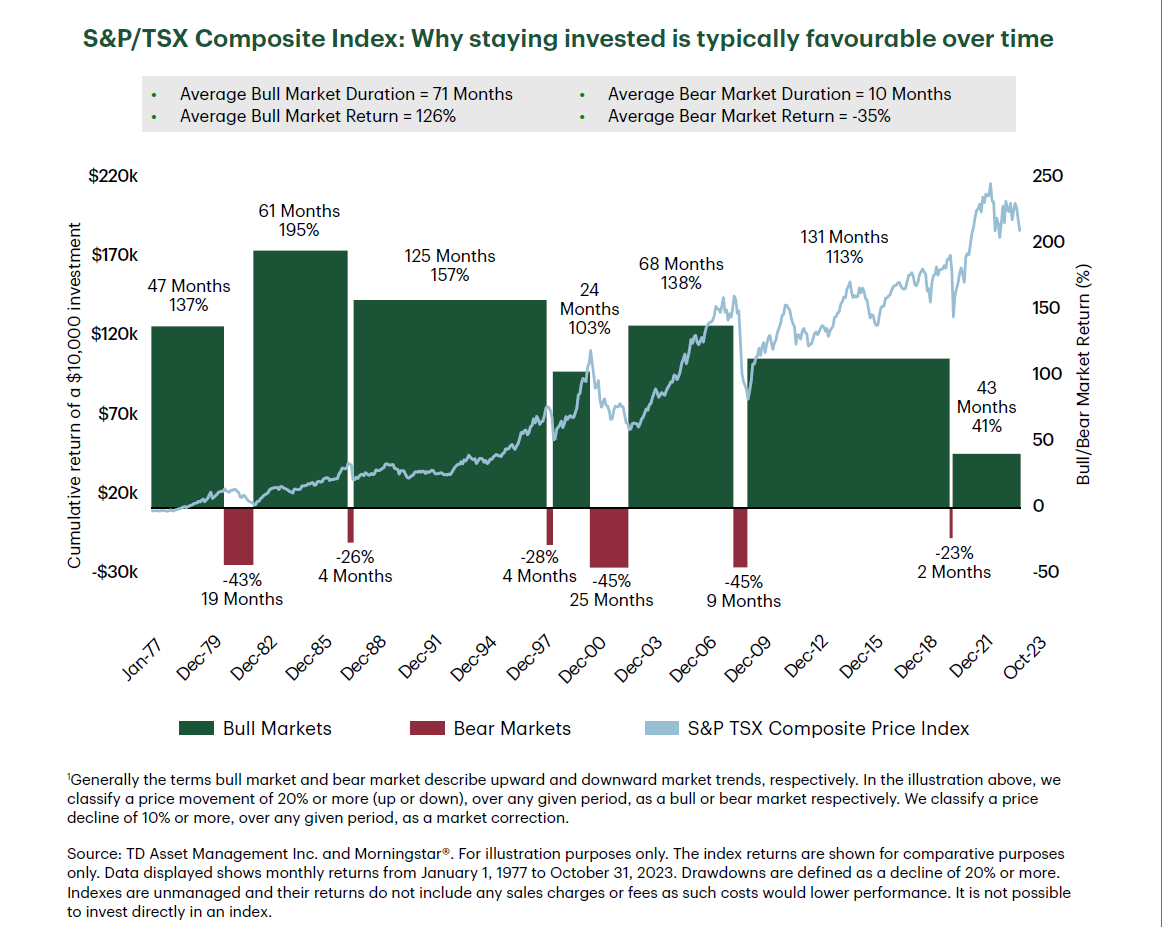
Equity markets in most countries go through periods of bull and bear markets on a regular basis. Bull markets propel valuations to astronomical levels sometimes and that leads to a eventual plunge. Bear markets, though painful, are not a time for investors to thrown in the towel. The recent decline during the Covid-10 pandemic was a classic scenario of this case. Stocks fell dramatically only to recover strongly in a few months. According to a report by TD Asset Management, Canadian equities have also recovered strongly after bear markets based on historical data. So it is important to remain invested even during bear markets as an investor can miss the strong recovery and further gains. The following chart shows the bull and bear markets in the Canadian equity market based on the S&P/TSX Composite Index returns from 1977 to Oct, 2023:
Click to enlarge
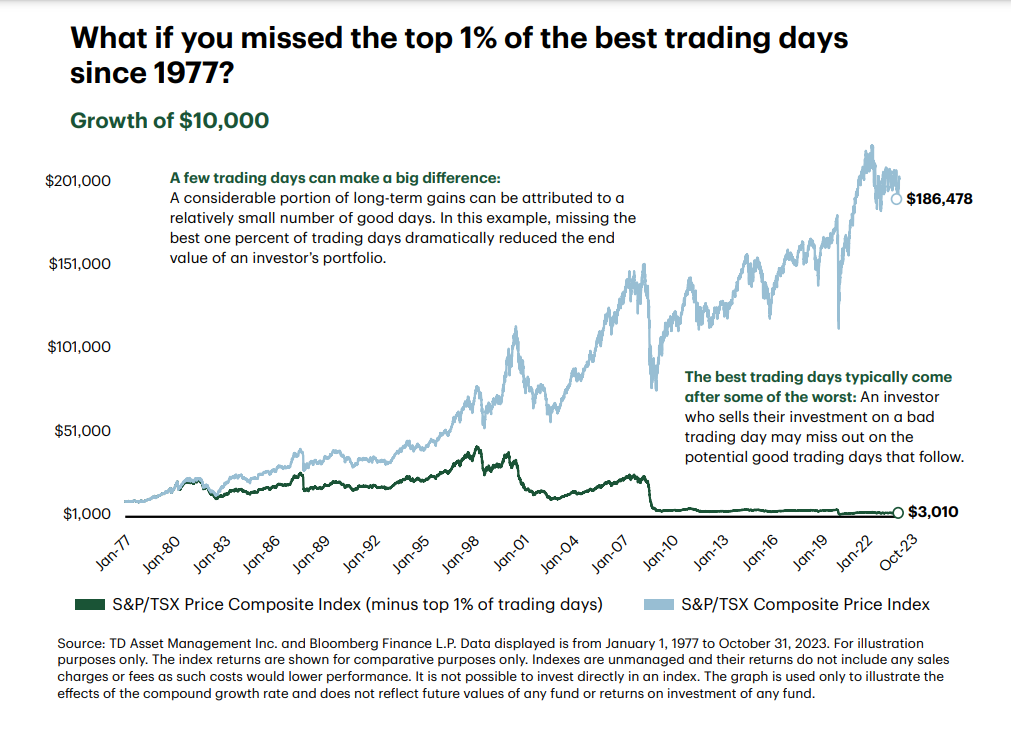
Missing a few trading days can make a big difference in returns especially over the long-term as the following chart shows:
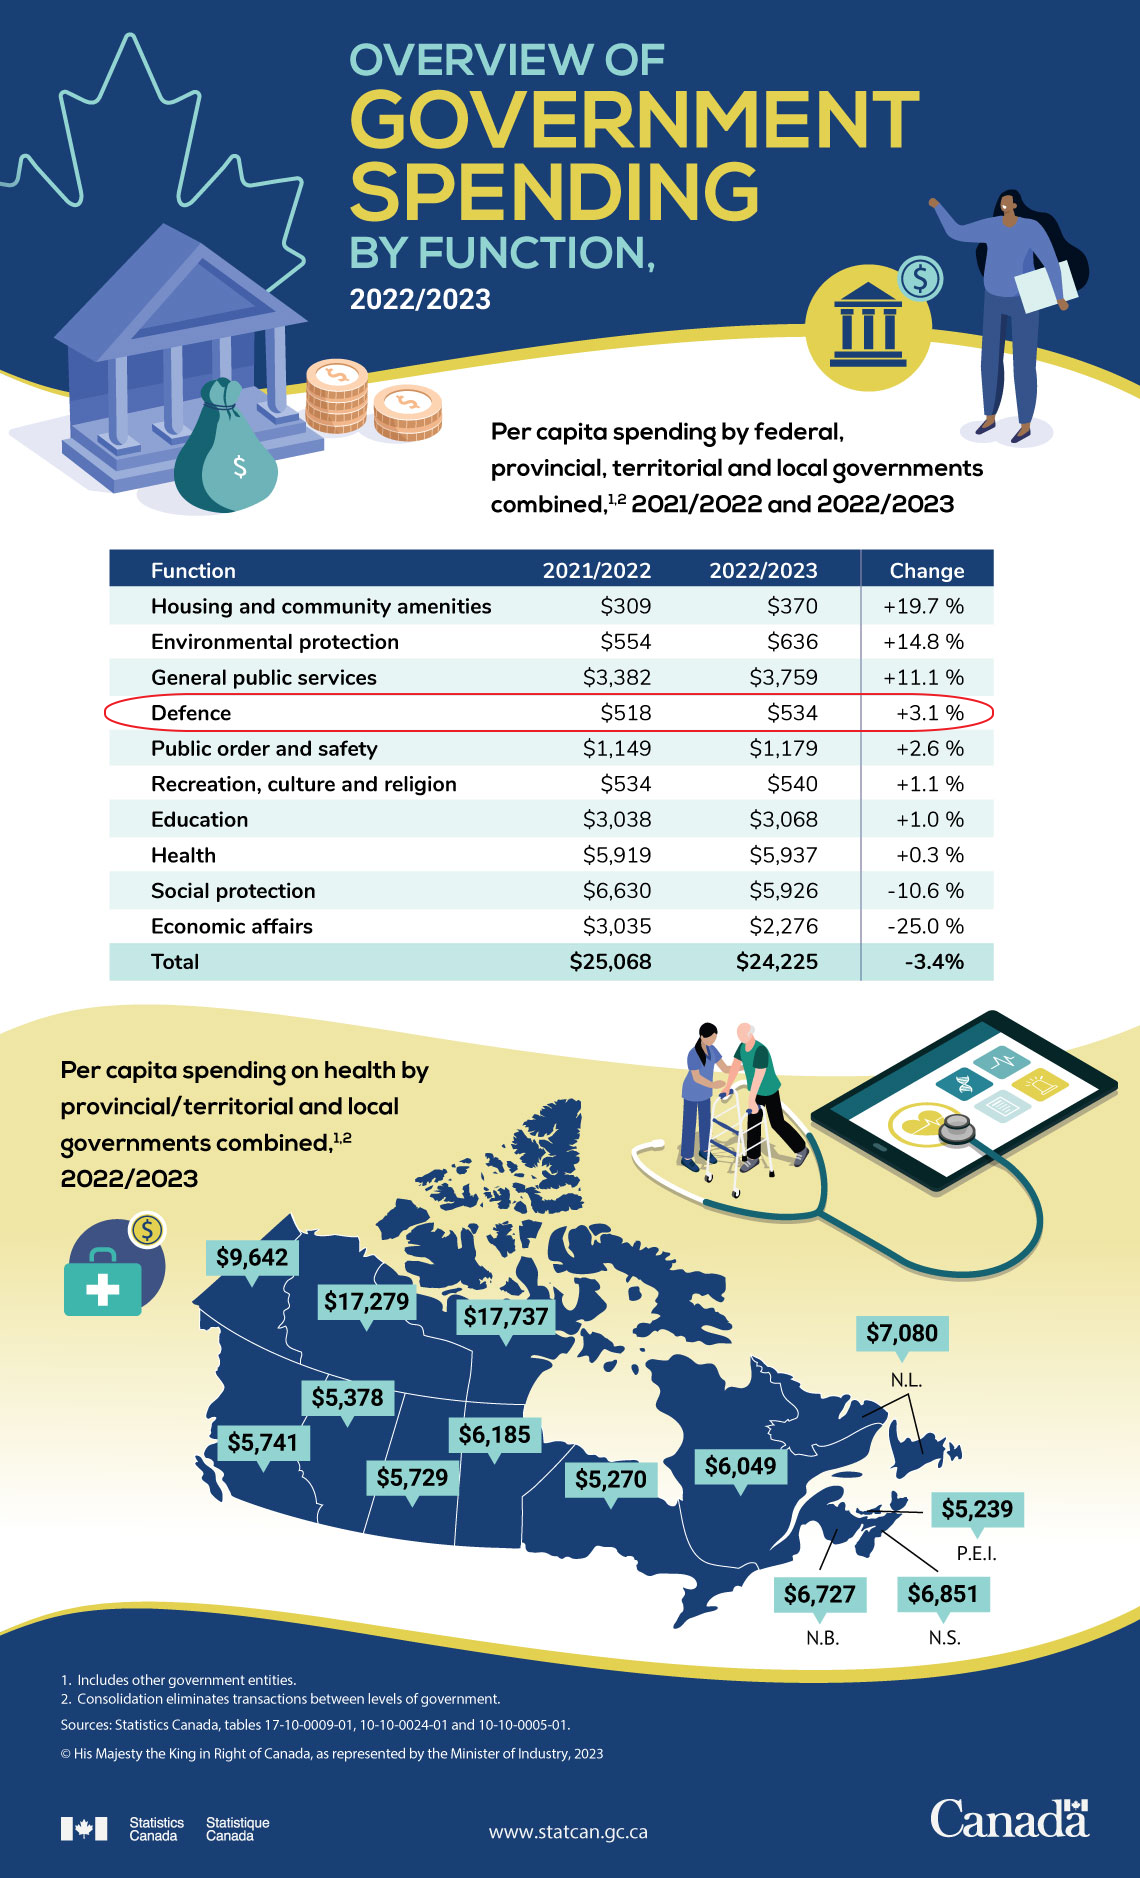
One of the arguments often made by Americans about its allies is their defense spending. It is not secret that most of Europe depends on the US to provide security while they focus their spending on social and other items. The same scenario is true with its neighbor Canada as well. Canadian defense spending is just 1.22% as a ratio of GDP in 2022 according to The Economist. Though the Canadian economy is about a tenth of the US economy, it is still huge at over $2.0 Trillion in 2023. So if Canada spends low on defense, what does the government spend on? The following infographic from Statcan provides some answers:
On a per capita basis, the spending on defense is very low as hi-lighted above. The highest spending goes to social protection and health based on 2022-23 data. One could argue that Canada can increase its defense expenditure. On the other hand, Canadians could argue their security is covered by the US and hence there is no need to increase it.
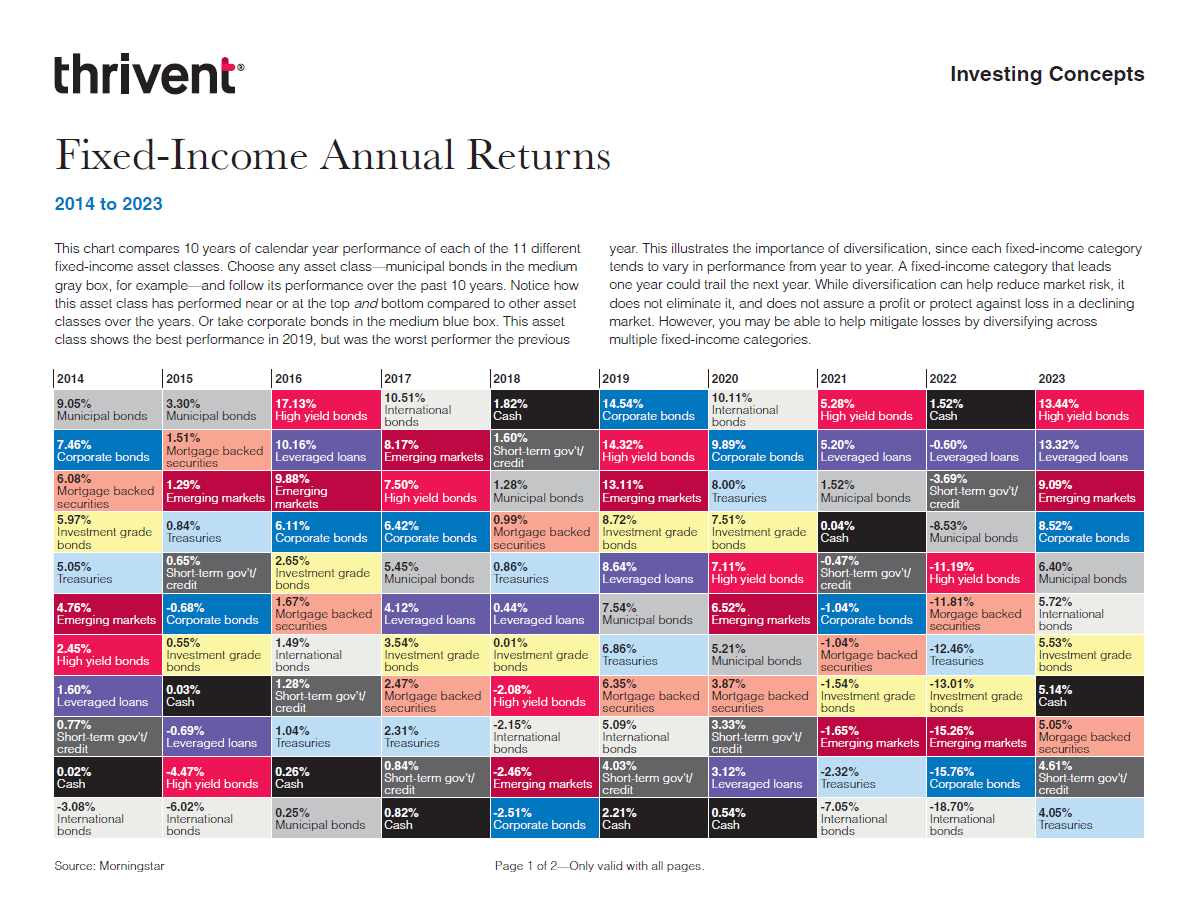
One of the simplest and easiest strategies for reducing risk with investing is diversification across asset classes. In addition to equities, it is important to hold fixed-income assets in a portfolio. Bonds can provide a cushion during adverse market conditions and one can also reinvest coupon payments in equities for instance or reinvest in other bonds. Cash also generates a decent return in this high interest time. I came across the below showing the annual return for fixed-income assets from 2014 to 2023. In the past 10 years, high-yields have earned positive returns in most of the years. Historically cash been the worst performer and earned poor returns in the period noted above as well.