The Top 10 Trading Partners of Germany in 2019 are shown in the chart below. According to The Federal Statistics Office (Destatis), China was the most important trading partner of Germany in 2019 for the fourth consecutive year. China was also the top import source country for Germany and the 3rd main export market for Germany after the US and France. Good worth about 206.0 billion Euros were traded between Germany and China (exports and imports). The US was the 3rd major trading partner with goods worth 190.0 billion Euros traded between the countries.
Click to enlarge
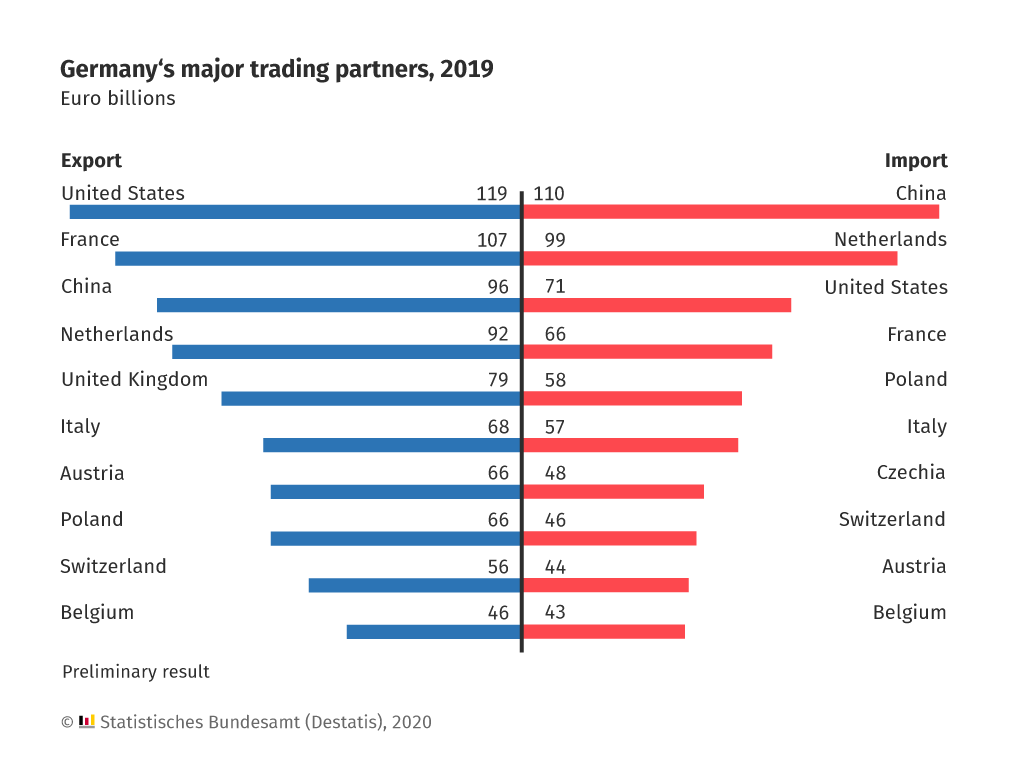
Source: Destatis
The top 3 export goods of Germany are motor vehicles, machinery and equipment and chemicals and chemical products.