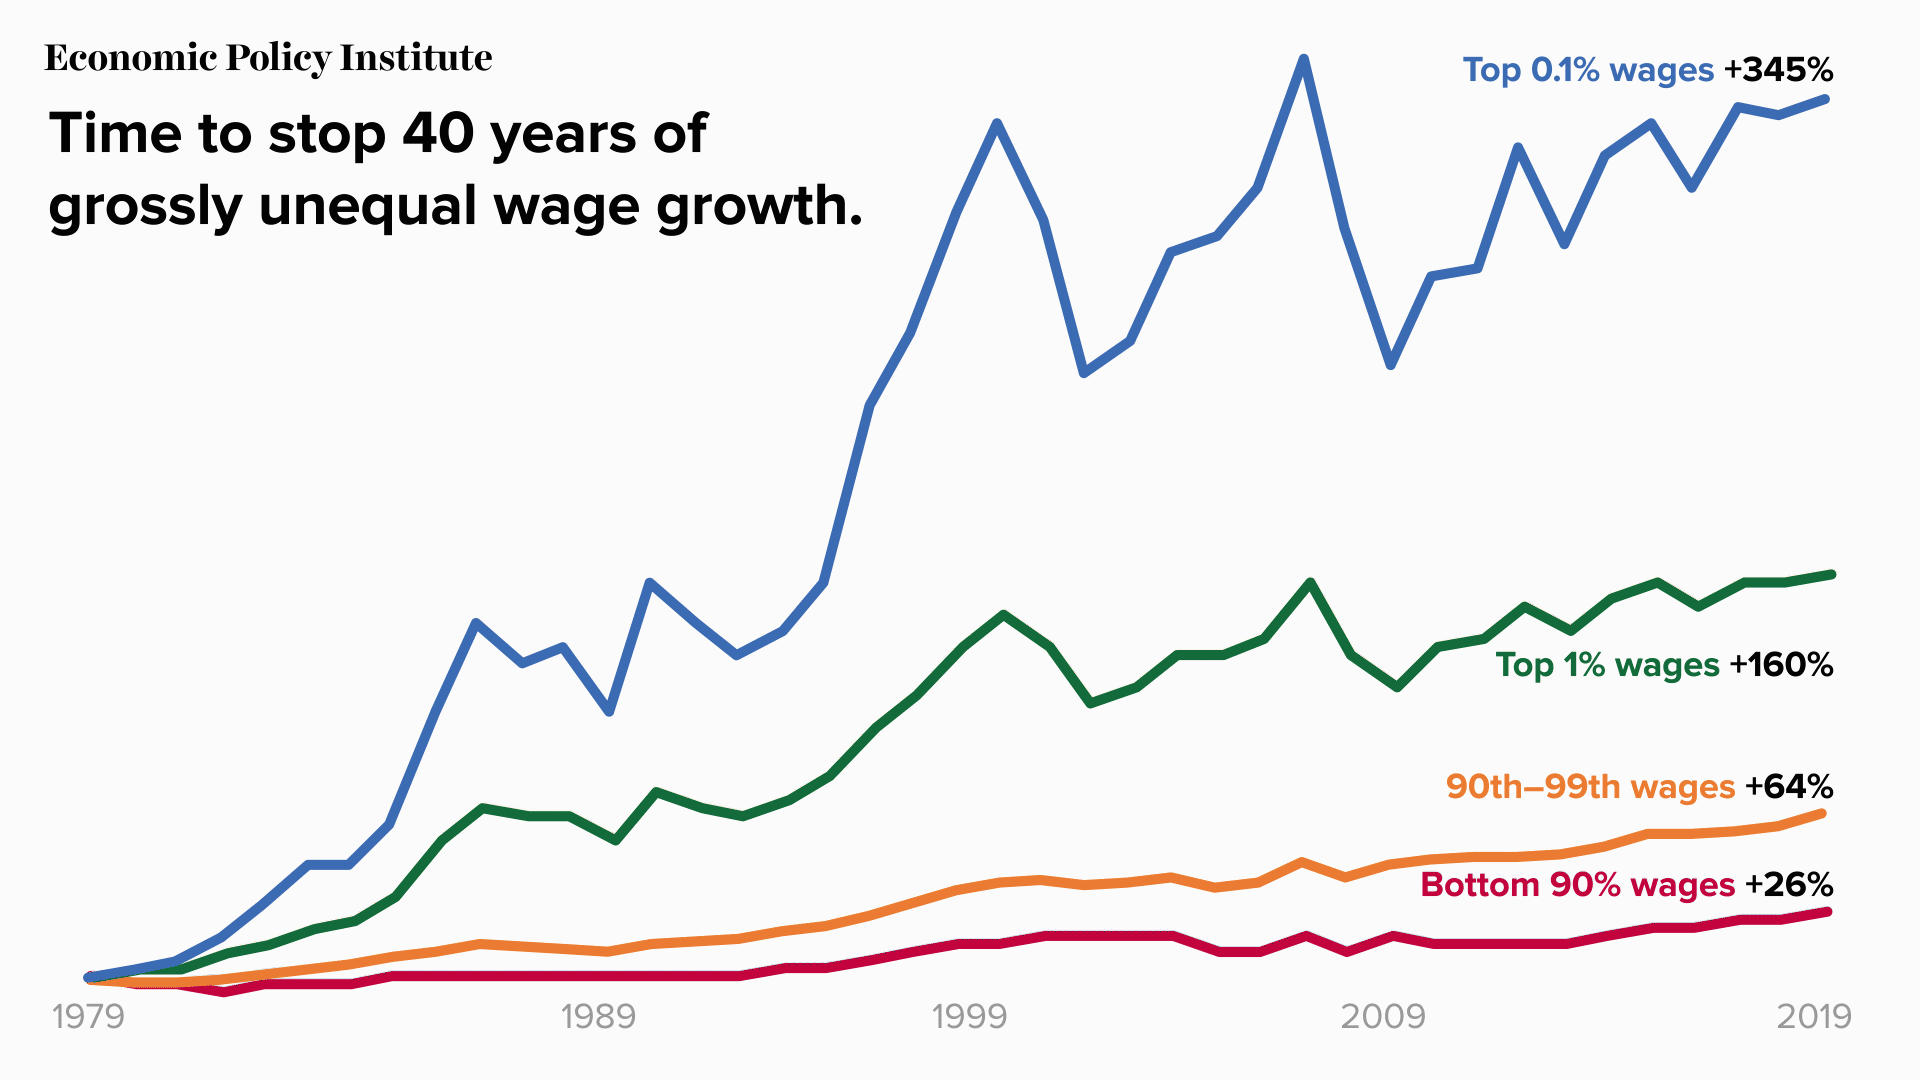
China’s Energy Composition 2011 To 2020: Chart

Coal is still one of the major sources of energy for many countries despite the growth of renewable energy sources. For example, China and India are to of the largest consumers of coal. Rising coal prices in the global market could negatively impact China’s economic growth. Though the country is the world’s largest coal producer, China depends on coal imports to help meet its energy needs according to an article at Deutsche Welle. Currently coal accounts for about 60% of China’s energy consumption. The Top 10 countries with the most coal-fired plants are shown in the chart below. After China, the US has the send highest number of coal plants at 286 followed by India.

Source: Coal crunch: Asia faces winter of discontent, DW

Though coal is the major source of energy in China, the renewable sources for energy is also increasing year after year. Non-fossil fuel energy has increased to 15.9% of installed capacity in 2020, up 8.5% form 2005 according to a white paper titled “Responding to Climate Change: China’s Policy and Actions” published by the State Council Information Office.

China’s Energy Mix 2011 to 2020:

Click to enlarge

China’s Non-fossil energy power generation composition:

Source: Graphic: China’s efforts in fighting climate change, China Daily

Related:

Some Fun Facts About Canada: Infographic

Canada is one the largest countries in the world. But did you know that Canada is actually the second largest country in the world based on land area? Recently I came the following infographic about some fun facts about Canada. Though this is a bit dated still it is useful to learn some fun facts about the great white north. From an economy standpoint, the Canadian economy is about one-tenth the size of the US economy. Generally the saying goes the US is an elephant while Canada is an ant.

Click to enlarge

Source: BIV

Why it is Important To Be Aware of Survivorship Bias in Equity Investing

One of the important concepts to be aware of with equity investing is the survivorship bias. Simply put this theory means ignoring losers and focusing on winners which can skew one’s thinking or results. For instance, hundreds of biotech firms are launched in the public markets but only a handful or even less are highly successful. Most biotech stocks end up being average or even worth less after a few years. However a select few such as Moderna(MRNA) and BioNTech(BNTX) turn into stars from their IPOs. Any analysis that ignores the biotech failures and simply concentrates on these firms would lead an investor to believe biotechs can create huge wealth easily.

Here is the definition from Wikipedia:

Survivorship bias or survival bias is the logical error of concentrating on the people or things that made it past some selection process and overlooking those that did not, typically because of their lack of visibility. This can lead to some false conclusions in several different ways. It is a form of selection bias.

Survivorship bias can lead to overly optimistic beliefs because failures are ignored, such as when companies that no longer exist are excluded from analyses of financial performance.

Recently I came an article on valuation multiples aptly titled Why valuation multiples fail in an exponential world. In this piece the author Amit Nath explains his theory using the examples of tech giants Microsoft(MSFT) and Amazon (AMZN). Of course this is cherry picking to the nth degree. In the dot com era hundreds of firms like Infospace, JDSU, eToys, Exodus, Looksmart, etc. disappeared forever. Even survivors like Intel(INTC), Cisco(CSCO), etc. caused losses in the billions for investors. The author makes the classic mistake of survivorship bias by high-lighting two winners from the dot com wreckage. He even shows the below chart that proves what a great stock Microsoft has been:

Click to enlarge

Source: Why valuation multiples fail in an exponential worldMontaka Global Investmentsvia FirstLinks

He makes the case for further growth in Microsoft’s share price with this statement:

In fact, under our bullish scenarios, we believe Microsoft’s share price could increase several fold, even from here.

Microsoft closed at over $309 a share on Friday and has a market cap of $2.32 Trillion. If Microsoft’s stock price increases 10-fold from here then its market cap would exceed the US GDP.

Similarly Amazon lost money for years and years before turning a profit. A variety of factors including the craze for cloud, the pandemic, etc. led to the soaring stock price.

Survivorship bias can also be found in the world mutual funds. Fund companies routinely get rid of poorly firming funds by merging them with well performing funds. This process magically eliminates the worst performers from the funds list and makes funds rating look better over the long run.

So the key takeaway is that investors need to be wary of articles that cherry pick a few stock to support a conclusion and avoid the big picture.

Disclosure: No positions

The Top 100 Global Auto Parts Suppliers 2020: Chart

The Top 100 Auto Parts Suppliers Worldwide in 2020 ranked by sales of original equipment parts in 2020 are shown in the charts below. The world’s top supplier was Robert Bosch of Germany followed by Denso (DNZOY) of Japan. Other top European players include Continental AG(CTTAY) of Germany, Faurecia (FAURY) and Valeo of France(VLEEY) and Aptiv(APTV) of Ireland. Among the North American auto parts makers, the top firms include Magna(MGA) of Canada and Lear(LEA), Adient(ADNT), Tenneco(TEN) and BorgWarner(BWA) of the US.

Click to enlarge

Source: Automotive News

The best way to profit from the automotive industry is not by investing in the auto makers themselves but by owning the auto parts makers. So investors interested in gaining exposure to this sector can use the above list for further research.

Disclosure: Long CTTAY, VLEEY, MGA and ADNT