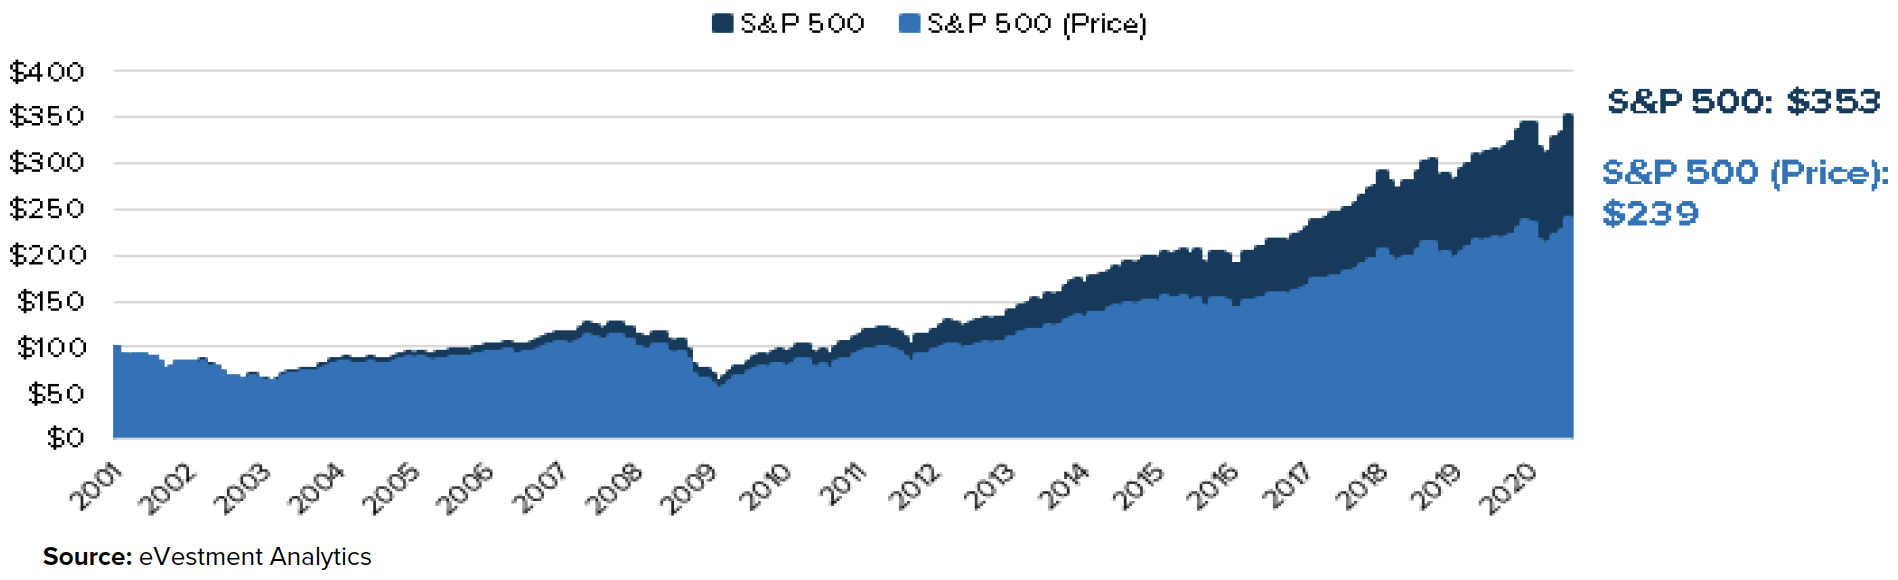
Success with investing in equities depends on many factors such as market conditions, quality of stocks held, dividend reinvestment, buying when stocks are super cheap, holding for the long-term, etc. Of all these factors one of the most important is the ability to identify and avoid common behavioral finance mistakes. Sometimes simply making wise behavioral choices can have better returns than making some actions even if no action is needed at all. For instance, during dramatic market declines such as during first quarter of 2020, investors who panicked and sold had a worse outcome in terms of returns than investors that just rode out the storm by absolutely doing nothing. This is because the S&P 500 has more than doubled since the market lows reached during that panic. A recent article at Manning & Napier discussed about how to avoid common behavioral mistakes. From the article:
A Variety of Cognitive Traps
Many of our irrational (aka. human) behaviors can often be attributed to specific behavioral biases. Be aware of common biases that impact the clarity of your decision-making. Examples include:
- Action Bias: The desire to take action, at any cost, in an effort to gain control over a situation.
- Overconfidence Bias: Starkly put, the tendency to overrate our own skills and abilities.
- Mental accounting: is the tendency to treat money, differently depending on where it came from or what we intend to do with it.
- Loss Aversion: The inclination to prefer avoiding a loss to realizing an equivalent gain (i.e., people would rather not lose $10 than gain $10).
- Present Bias: The idea that we are time-inconsistent, this bias causes people to place greater value on a reward today than they would on a reward in the future, typically to the detriment of our future selves.
- Recency Bias: Causes one to overemphasize recent events/results over historic ones.
- Herding Behavior: An investors’ tendency to track what other investors are doing, rather than their own analysis.
Certain people may be more prone to some over the other of these biases, and at times, broad economic and social situations can cause these biases to occur more frequently and on a larger scale, than usual. For example, the stress associated with the past election, dramatized news cycles, and the global pandemic are having detrimental effects on our psyche, causing some biases to become more prevalent and influence the way we behave.
Source: Avoiding common behavioral mistakes, Manning & Napier
An example of Action Bias is the scenario I discussed about some investors that took action during the market decline of early 2020. Overconfidence bias can take many ways. For example, an investor that had bought Zoom Video Communications Inc (ZM) in late 2019 may make outsize bets on similar stocks. But obviously buying Zoom before the pandemic was luck more than anything.
Recency bias is also pitfall that is difficult of avoid. Simply put this bias means putting more emphasis on recent events or situations and assuming same thing will happen in the future. Some examples of this bias include buying lots of Covid vaccine stocks hoping that the great run will continue in the future or assuming chips shortage would continue indefinitely or thinking Gamestop (GME) stock would go to the moon based on events earlier this year than its historical average to poor performance. Like other species, humans also tend to behave in herds. Just because other investors are jumping into crypto or meme stocks does not mean one needs to as well.
Disclosure: No Positions