Investing in dividend-paying stocks is an important strategy for success with investment in equities. Stocks that not only pay dividends but also increase them consistently over time are even better for long-term investment. Picking and holding dividend growers and reinvesting dividends automatically can generate excellent total returns if held over a decade or more. I have written many times before this strategy before as you can see here and here and here. Recently I came an article that showed the power of dividends using the example of the fast food giant McDonald’s(MCD). From the article by Joyce Gordon at Capital Group:
Supersize me: The power of reinvested dividends
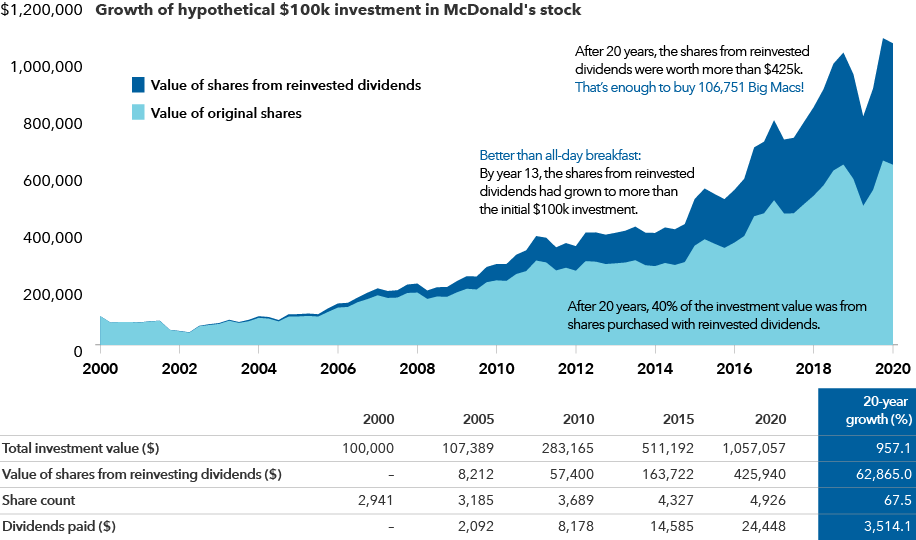
One company that has consistently grown its dividends is McDonald’s. To get a sense of how regularly reinvesting dividend payments can compound over time, consider a hypothetical $100,000 investment in the company for the 20 years from December 31, 2000, through December 31, 2020, with all dividends reinvested.
Big Macs were probably not what Albert Einstein imagined when he called compound interest the “Eighth Wonder of the World.” But the power of compounding can be a wonder to behold.
In this hypothetical example, the total return of the investment would have been impressive — from $100,000 to $1,057,057, a 957% gain.
Reinvested dividends: Better than breakfast all day
Sources: Capital Group, FactSet. Growth rate calculations for value of shares from reinvested dividends and dividends paid use the first year’s dividends payment ($676) as a starting value. This information should not be considered a recommendation to purchase or sell a particular security and is provided for illustrative purposes only.
Take a look at what happened with the dividends. The value of shares from reinvested dividends would have grown from $676 in 2001 to $425,940 in 2020, or enough to purchase more than 106,000 Big Macs last year.
The special sauce of compounding in this example lies in the growth in share count from reinvested dividends. The number of shares purchased with the original investment would have been 2,941. By the end of the 20 years, the share count would have increased to 4,926, a 67% increase. For the length of the investment, dividend payments would have represented 40% of the total return.
Source: Dividend growth: The special sauce of long-term investing, Joyce Gordon, Capital Group
The author uses $100K as the original investment in a single stocks. Most retail investors are unlikely to have this amount to invest in one stock. However we can use this case study with a smaller at $10K and the final return of over $100K is great as well.
Who knew that an average fast food company can yield such spectacular returns !
The complete article linked above is worth a read.
Disclosure: No Positions