
The Annual Returns of India’s benchmark S&P BSE Sensex Index from 1991 thru 2024 are listed below:
Data Source: Bombay Stock Exchange
– Updated: Sept 1, 2024
Select S&P BSE Sensex Charts are shown below:
Click to enlarge
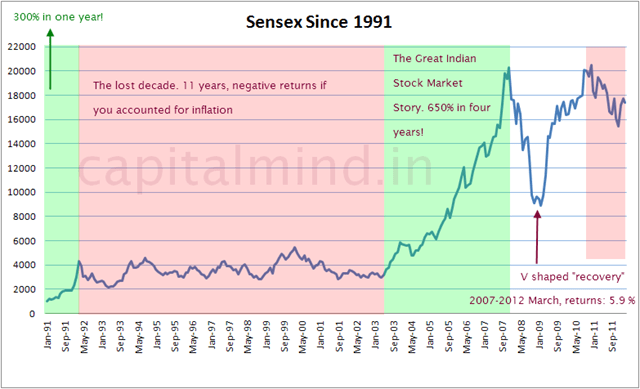
1. Sensex Return Chart from 1991 to 2011:
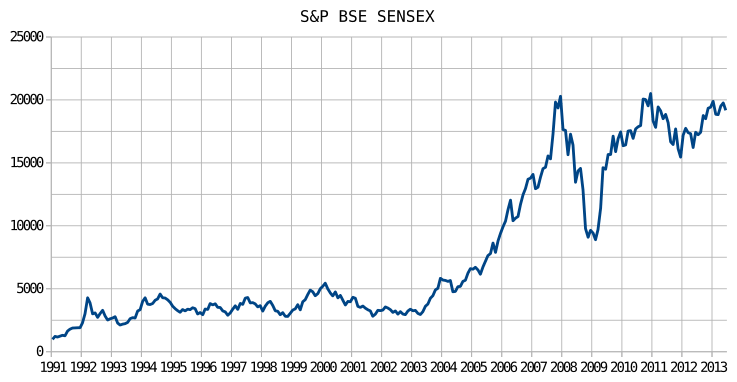
2. Sensex from 1991 to 2013:
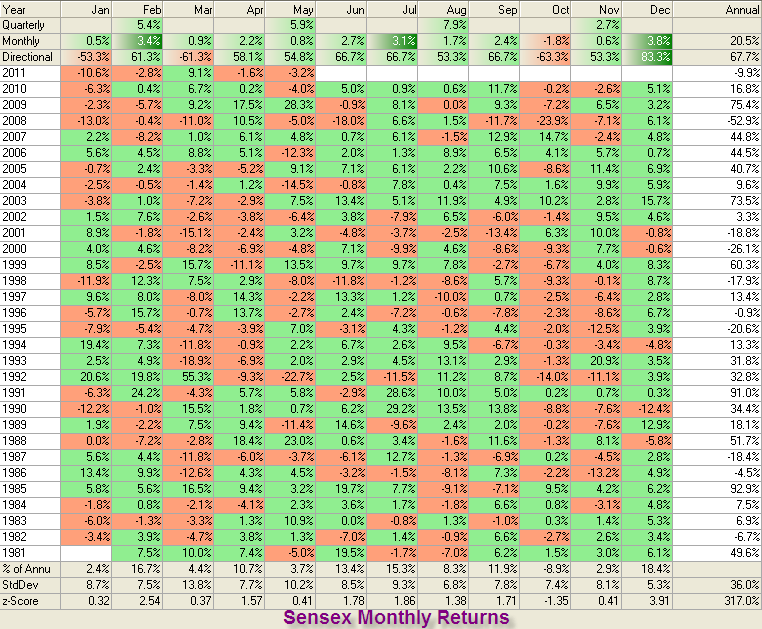
3. Sensex Returns by Month and Year 1981 to 2011:
4.Sensex Annual Yearly Returns 1991 to 2018:
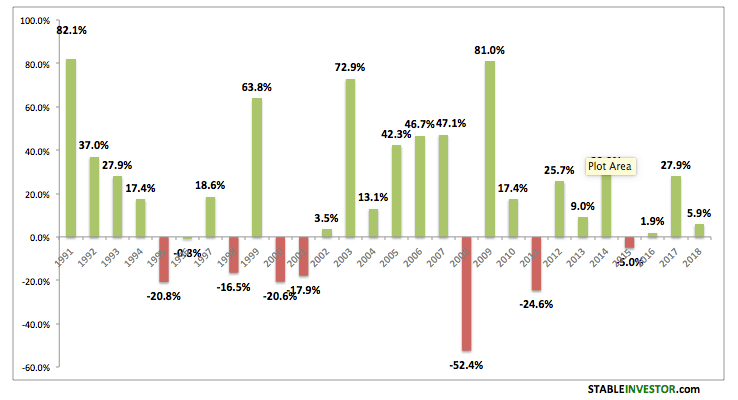
Source: Stable Investor
5.Sensex Price Returns vs Total Returns:
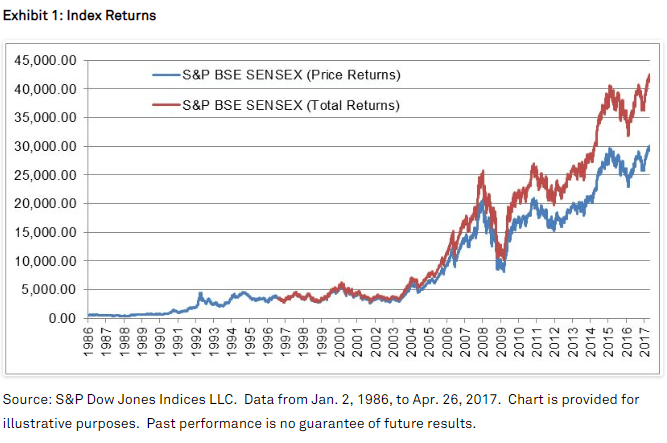
Source: S&P
6:Sensex’s roller-coaster journey: From 100 to 39,000:
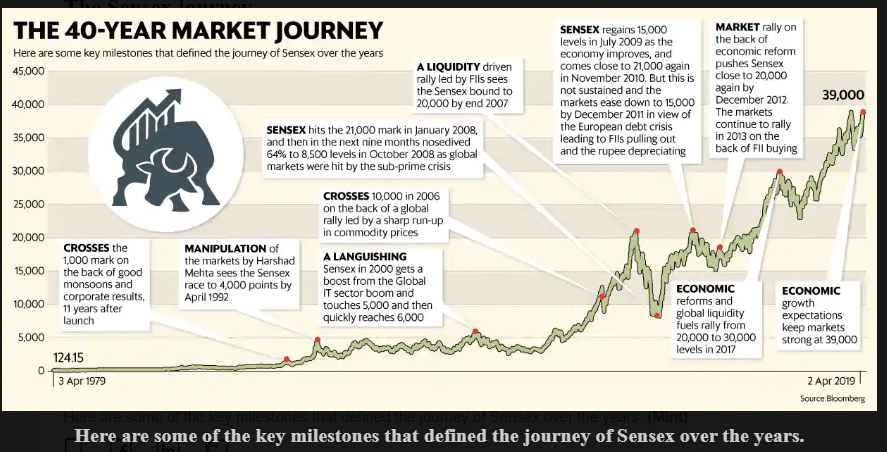
Source: LiveMint
7: Sensex – 10 Worst Single Day Crashes:
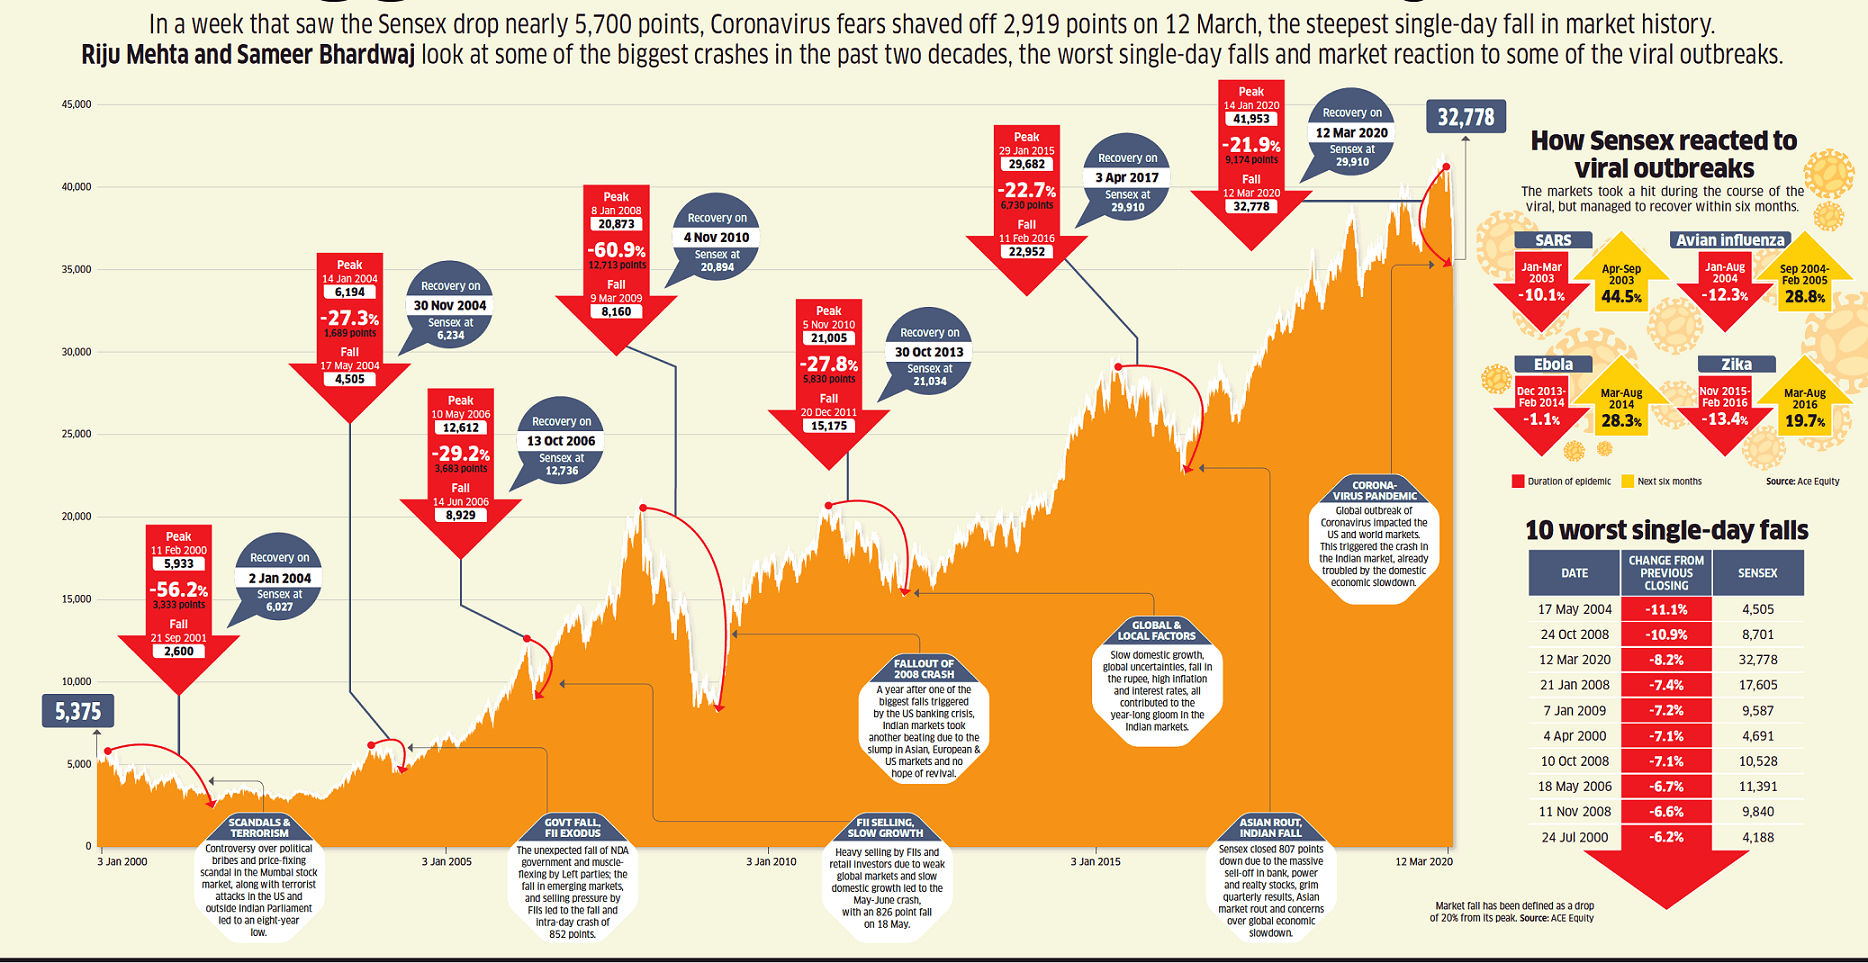
Source: Be Money Aware Blog
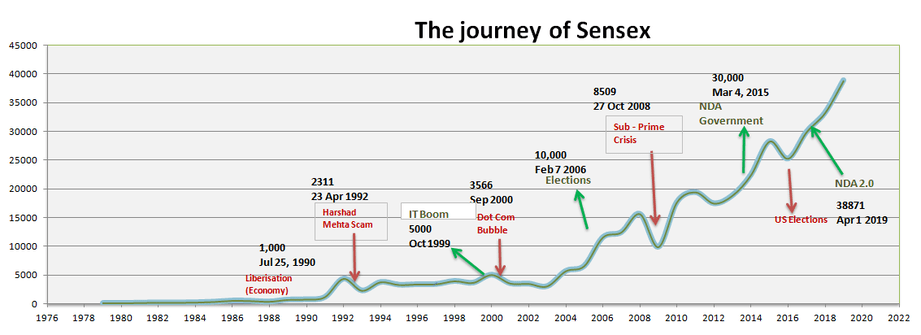
8. Journey of Sensex 1980 to Early-2020:

Source: Finvista via Twitter
9.Sensex 1995 to 2017 Chart:
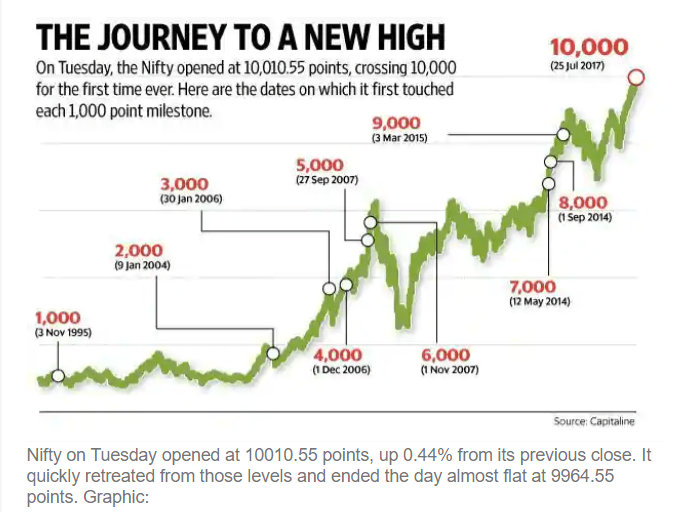
Source: LiveMint
10:Sensex – 40 year Chart From 1979 to 2019:
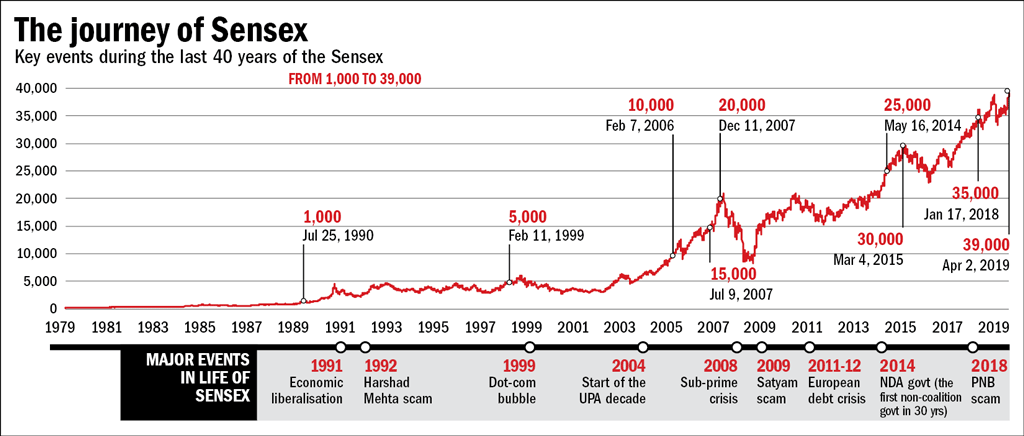
Source: Trading Q&A
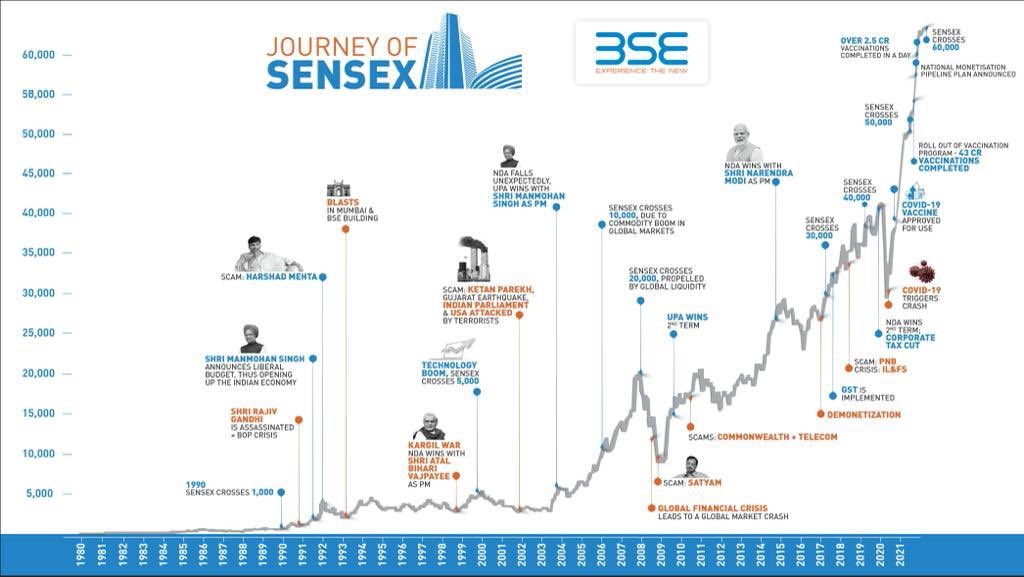
11.Journey of the Sensex since inception:
Click to enlarge
Source: The Economic Times
12. Sensex biggest Intraday Falls Chart:

Source: Sensex’s 1,689-point plunge not even among 5 biggest crashes in BSE history!, The Economic Times
13.Sensex Peaks and Troughs from 1985 to 2020:
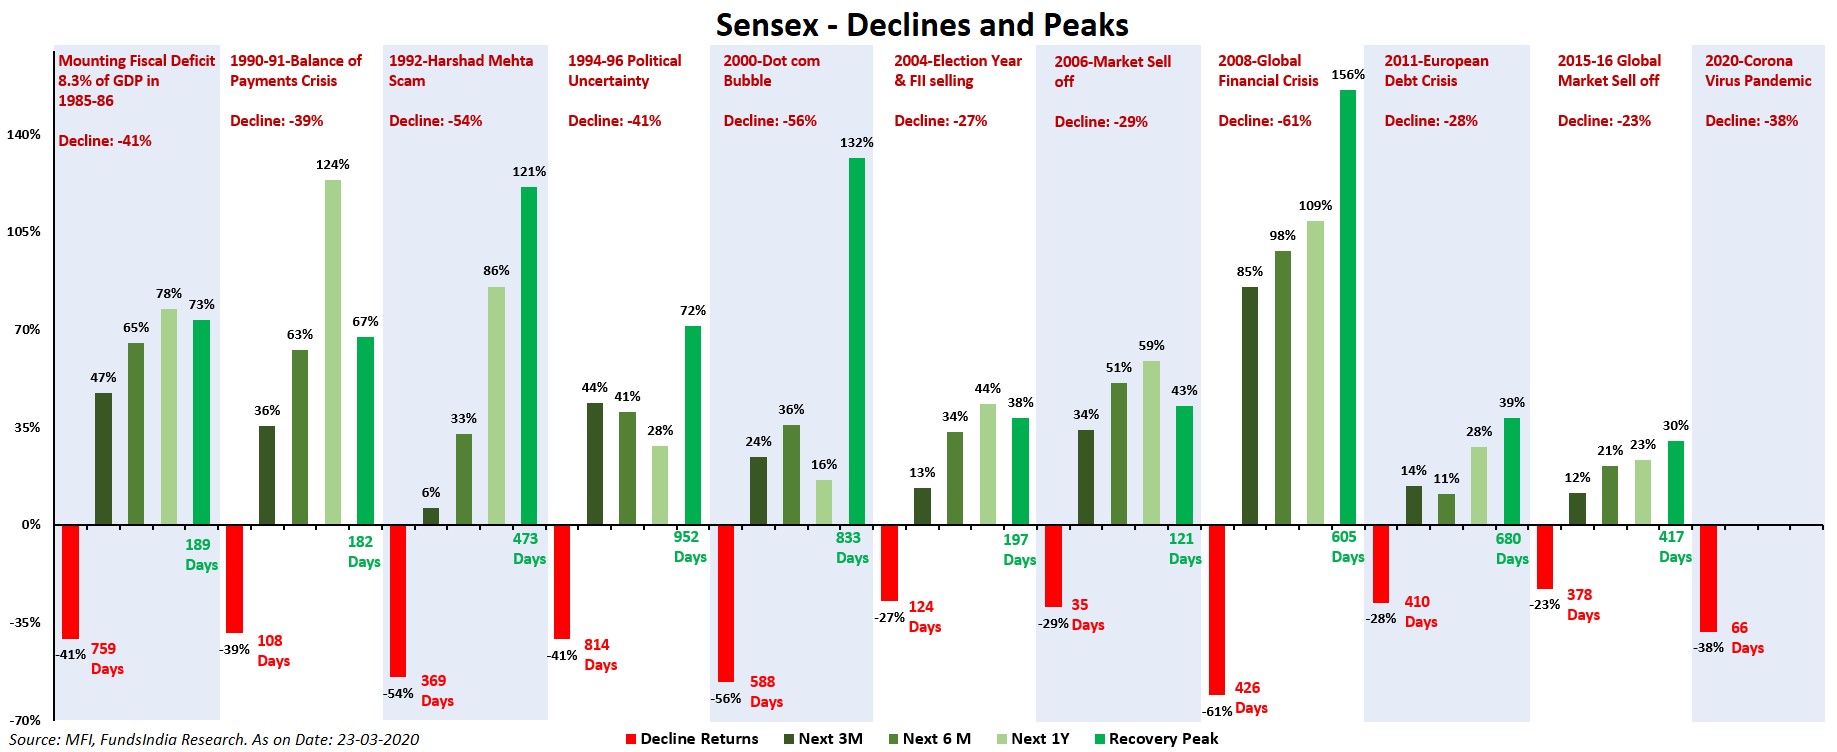
Source: FundsIndia
14.The Biggest Single Day Sensex Crashes – From 2008 Thru 2020:
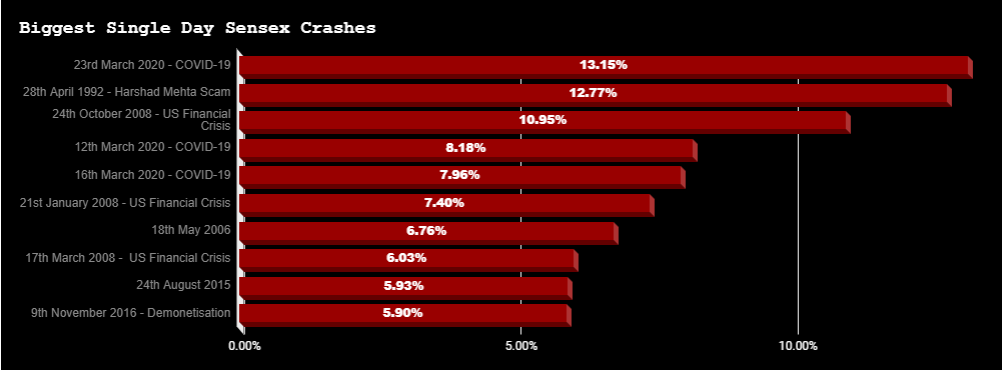
Source: Tradesbrain
15.Biggest Sensex Falls:

Source: MoneyControl
16.Sensex Journey to 50,000:

Source: The Hindu Business Line
17.Sensex Journey – From 1,000 to 50,000: Infographic:

Source: Business Today
18.Sensex Six Fall years in 25:
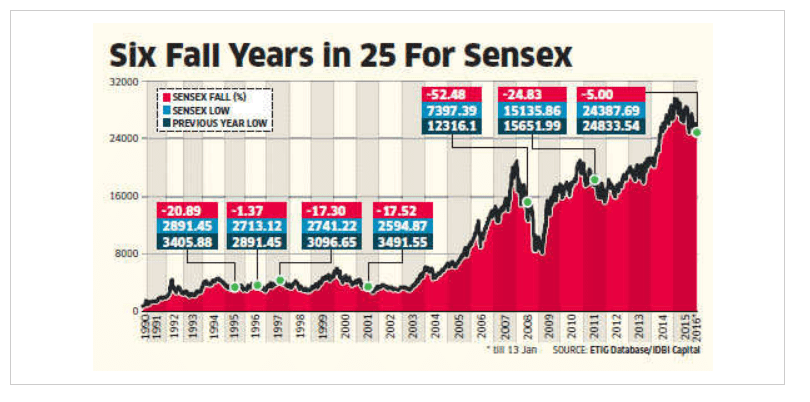
Source: The Economic Times
19.Sensex 5-Year Returns:
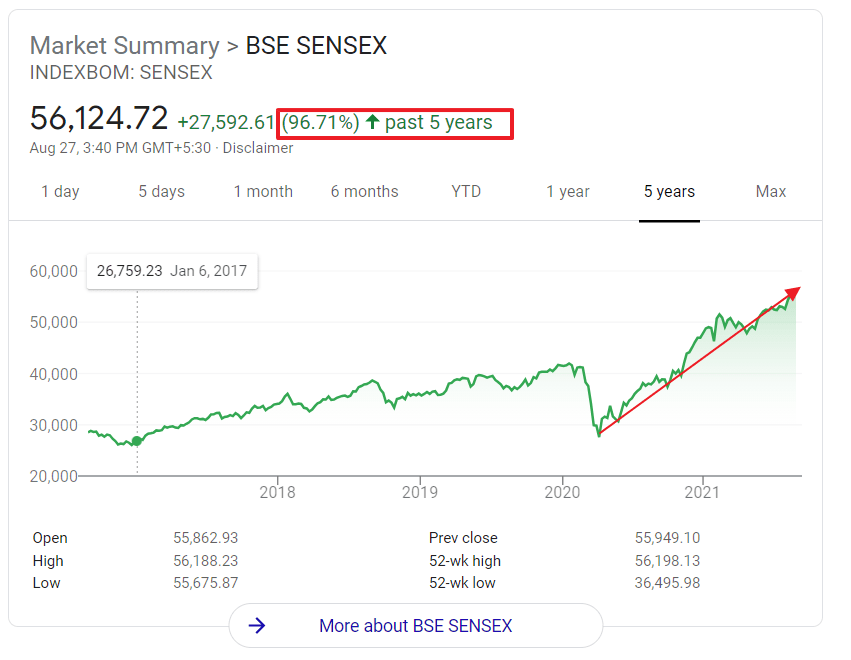
Source: Google Finance
Updated: Sept 25, 2021:
20.Sensex at 60,000:
Source: Sensex Crosses 60,000-Mark for First Time; India is Now World’s 6th Biggest Stock Market, India.com
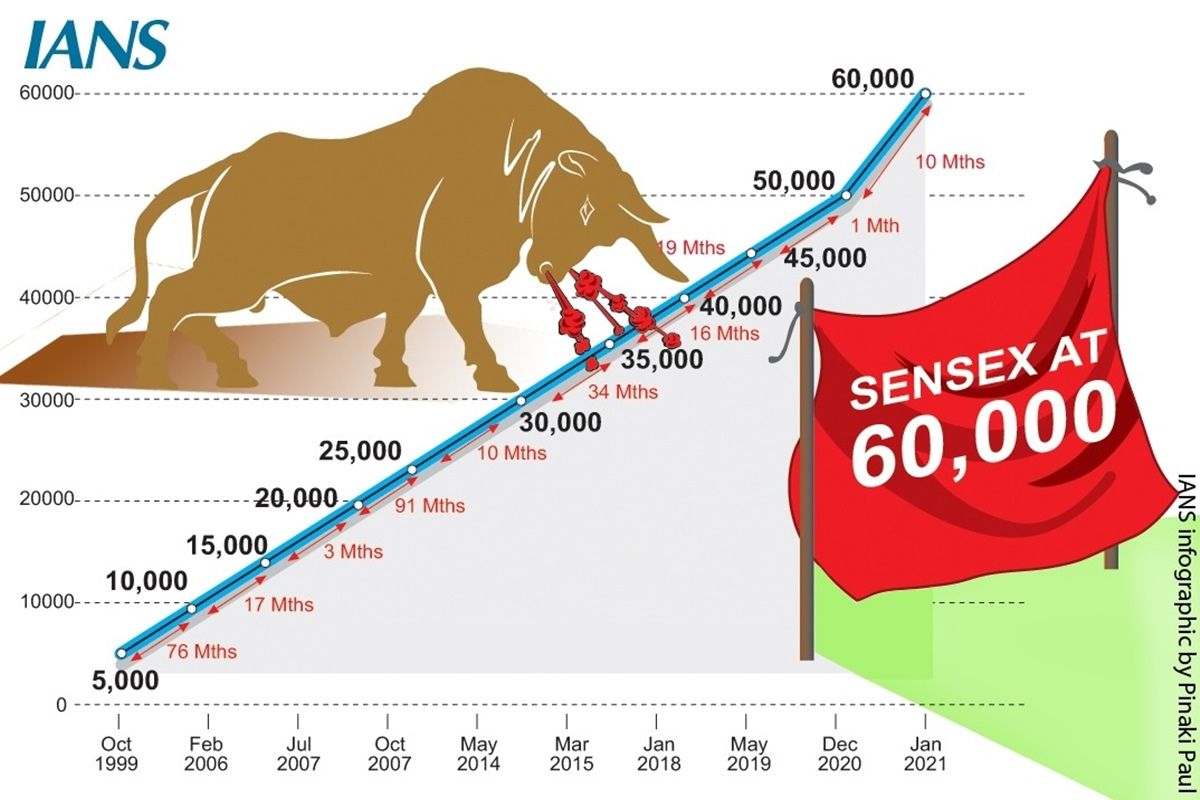
21.Journey of Sensex to 60000:
Source: BSE CEO @ Twitter
22.Sensex – From 1000 to 60000:

Source: Sensex Hits 60,000 For The First Time: Journey In Charts, Bloomberg Quint
23.Sensex Roller Coaster Ride from 1986:
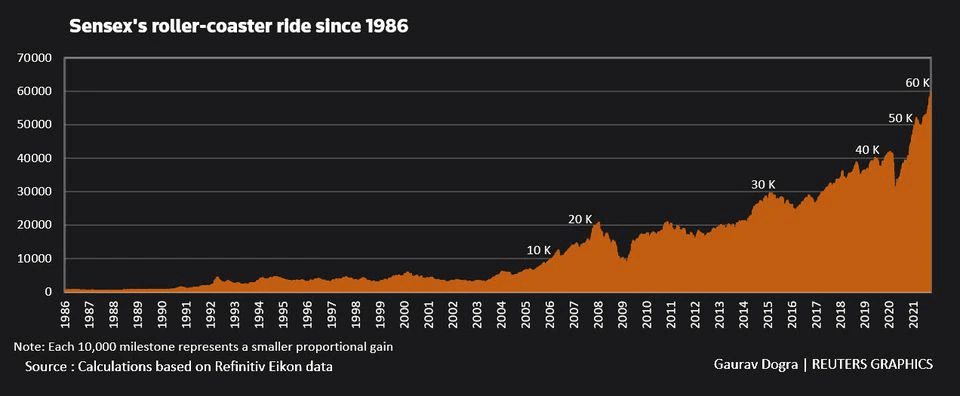
Source: Reuters
24.Sensex- Peaks and Troughs from 1985 to 2020:

Source: Unknown
Sources:
Also see:
A very much informative page for the one who is trying to study the markets. I would be really happy to share my blog page on basics of the financial topics too.