The latest poverty data available from the Census Bureau is for the year 2007. The official poverty rate in the US was 12.5 % in 2007. Put another way, 37.3 million people were in poverty up from 36.5 million the previous year.
Click to Enlarge
Source: U.S. Census Bureau
The 37.3 millions does not include people in institutional group quarters (such as prisons or nursing homes), college dormitories,military barracks and living situations without conventional housing (and who are not in shelters). The poverty threshold in 2007 for a couple with two children was $21,027.
The above chart shows that number of people in poverty has been rising since 2000. The latest population of the US is 307 million. With unemployment rate at 9.4% in July and household debt at high levels, more people may be pushed into poverty.
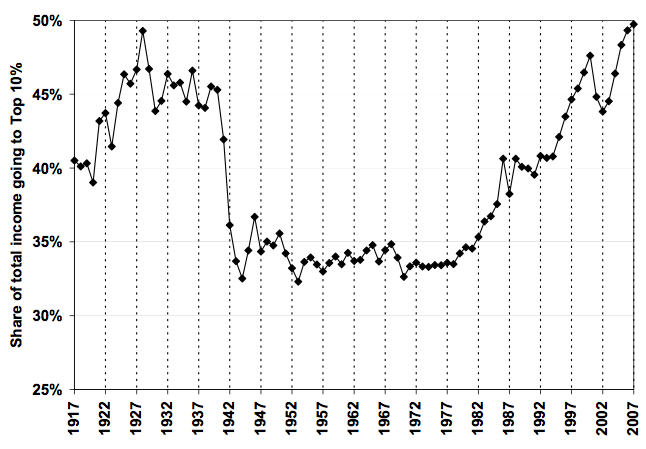
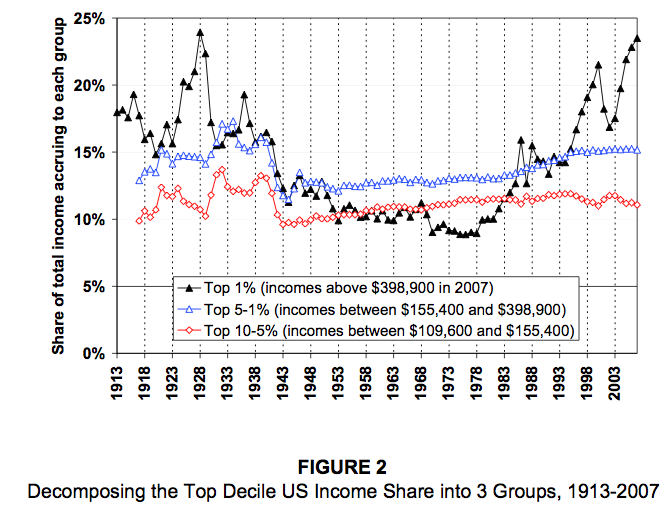
When we compare the rising poverty levels to the income distribution, the correlation is interesting.As the charts below show clearly, the rich are getting richer and the poor are getting poorer.
Click to Enlarge
Source:Â Striking It Richer. The Evolution of Top Incomes in the United States, by Emmanuel Saez,
UC Berkeley
In the past few years, the wealth and income inequality in the US is rising to record high levels. During the 2000 presidential campaign in New York, gazing at the diamond-studded $800-a-plate crowd Presidential candidate George W. Bush commented:
“This is an impressive crowd – the haves and the have-mores,” quipped the GOP standard-bearer. “Some people call you the elites; I call you my base.”


