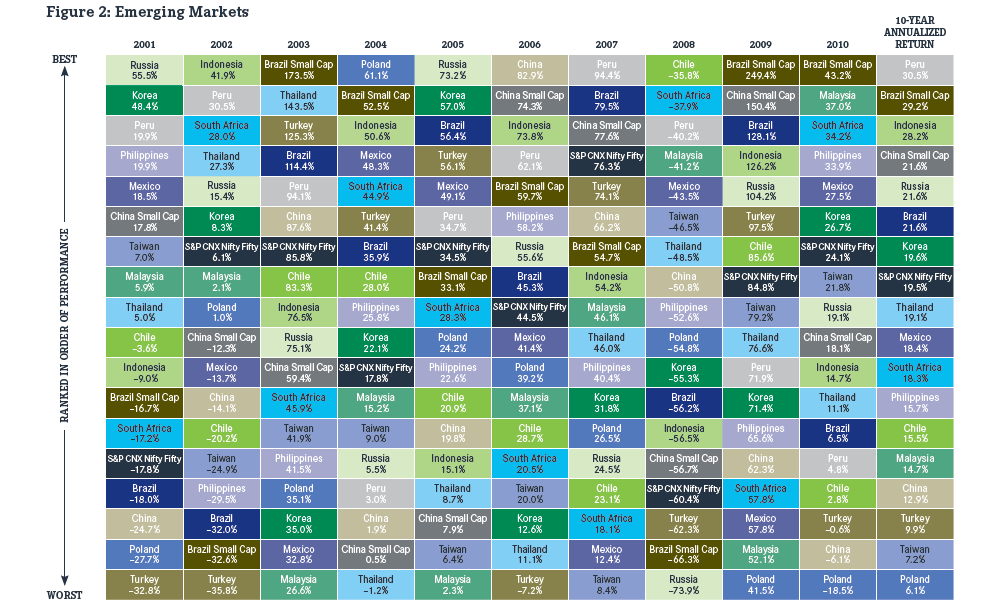
The chart below shows the Periodic Table of Investment Returns for individual countries in the emerging world from 2001 to 2010. The returns are based on the MSCI and S&P data:
Click to enlarge
Source: iShares
Some observations:
- The frontier market of Peru was the best performing market in terms of 10-year annualized returns beating even Brazil.
- Russia is a very volatile market with returns varying widely each year.Though Russia fell about 74% in 2008 it soared 104% the following year.
- Chile is also a top performing market in most of the years shown.
- Despite high economic growth, China yielded an average 10-year annualized return of just 12.9% which is lower than the annualized return of most other emerging markets including Chile, Mexico, Brazil and Malaysia.
Related ETFs:
iShares MSCI All Peru Capped Index Fund (EPU)
iShares MSCI Indonesia Investable Market Index ETF (EIDO)
iShares MSCI Brazil Index (EWZ)
Market Vectors® Russia ETF (RSX)
iShares MSCI Chile Index Fund (ECH)
Disclosure: No Positions
Also checkout:
Periodic Table of Style Rotation — Stocks and Bonds 2004 To 2013 (in pdf)
