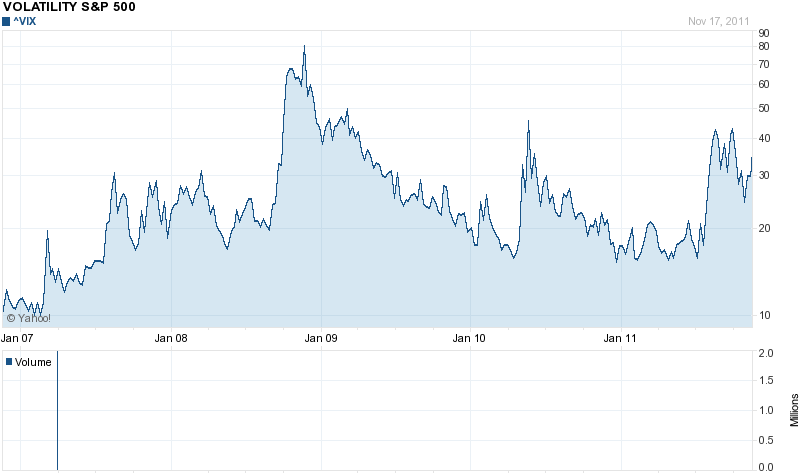
Volatility in the U.S. stock market has been extreme in the past few years. The following chart shows the 5-year chart for the VIX index:
Click to enlarge
Source: Yahoo Finance
After peaking in late 2008, the fear index started to moderate until the middle of this year after which it has spiked again due to the European debt crisis and other factors.
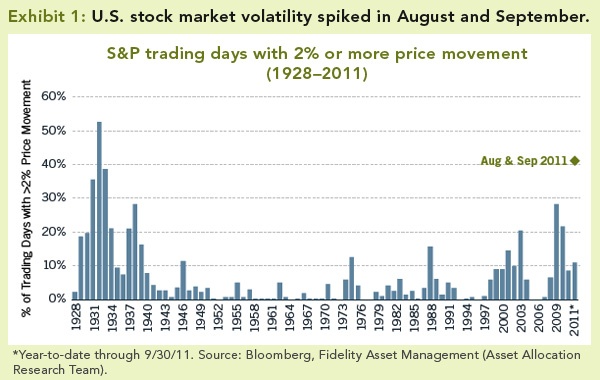
A research report by Fidelity notes that more recently markets are driven mostly by macro issues. The following chart shows the volatility in the S&P 500 since 1928:
Source: Macro-driven markets: What asset prices are signaling, Fidelity Investments
From the Fidelity report:
In August and September, asset prices fluctuated wildly: Over 40% of the trading days in the U.S. stock market experienced either up- or downswings of more than 2%—a degree of instability similar to the 1930s (see Exhibit 1, below). This volatility could be attributed to a limited number of factors, implying that investors were reacting to the same small set of phenomena. It was driven primarily by macro uncertainties, in particular, the eurozone financial turmoil and the U.S. government debt ceiling debate. The volatility was further exacerbated by the dominance of short-term and index-oriented trading—including high frequency trading, program trading, and ETFs—that triggered sharp moves among broad baskets of securities.
High volatility in the markets is not beneficial to long-term investors but is a boon to short-term traders. Strong fluctuations in equity prices also confirm investors’ lack of confidence in holding equities for the long-term.
Related ETF:
SPDR S&P 500 ETF (SPY)
Disclosure: No Positions
