The current U.S. total public debt outstanding exceeds $14.8 Trillions. This huge debt has been accumulated over many years under the of administrations of both Republican and Democratic presidents.
Just like a business it takes money to run a government. One of the main sources of revenue for governments is taxes. So Tax Revenues as a percentage of GDP is an ideal measure to determine if a country’s tax collections is high or low. Based on this measure, the U.S. ranks lowest among most of the developed countries.
According to a recently released OECD report, the Tax Revenues as a percentage of GDP for the US was just 24% in 2009, the latest year for which data is available. This is lower than most other developed nations with sample countries like Denmark at 48.2%, UK at 34.3%, Canada at 31.1%, etc. Of course, higher taxes collected by these countries helps pay for generous benefits to citizens such as free high-quality healthcare for all, education, unemployment insurance, etc.
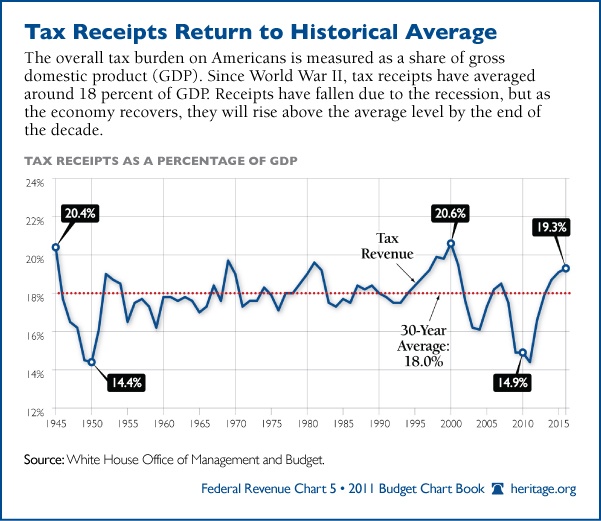
Until now the lower tax rate regime in the U.S. worked fine since the economy was mostly growing and a lower percentage of the population was dependent on the state for survival. However that scenario has changed dramatically in the past few years due to the sluggish economy. The U.S. Federal government’s tax revenues as a percentage of the GDP has for the most part stayed at around around 20% or lower while expenditures have increased due to wars, soaring healthcare costs, social security and other entitlement programs. Hence unlike other developed countries, in the U.S. the gap between tax revenues and expenditures is widening at an alarming rate. With both the parties unable to increase taxes or decrease expenditures substantially, the situation is bound to get worse in the future.
The table below lists Tax Revenues as a percentage of GDP for OECD countries:
[TABLE=1046]
Source: OECD
The following graph shows the U.S. Tax Revenues as a percentage of GDP from a historical perspective:
Click to enlarge
Source: 2011 Budget Chart Book, The Heritage Foundation


