The behavior of stock market tends to follow a cycle.Similar to many conditions of an economy such as expansion, contraction, stagflation, etc. stock markets also go thru periods of booms followed by bust.
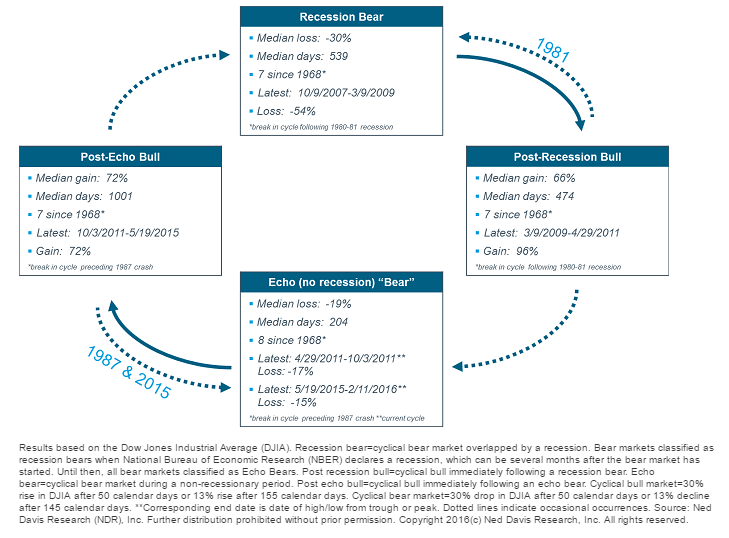
The following is an interesting chart by Liz Ann Sonders at Charles Schwab. According to an article by Liz, the stock market tends to have four cycles.
Click to enlarge
From the article:
The stock market has familiar cycles dating back to at least the 1960s. The visual below (and the accompanying detailed set of tables below that) highlights these cycles and their direction. Each box in the graphic below shows the median return and duration for the seven of these cycles we’ve seen since 1968; but also the return and duration for the most recent phase of the current cycle. The cycles utilize the bull and bear market definitions pioneered by Ned Davis Research (NDR), which are more nuanced than the simple +20%/-20% traditional definition.
The full article is worth a read.
Source: Echo: Are Stocks Getting Back in Cycle? by Liz Ann Sonders, Charles Schwab
