Some interesting charts from the FDIC Quarterly Banking Profile report are shown below:
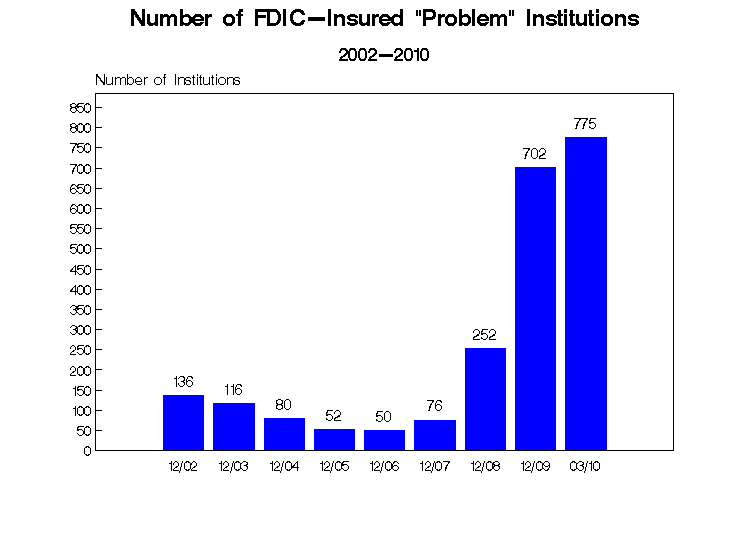
1. Number of “Problem” Banks
Yesterday the FDIC shutdown Nevada Security Bank of Reno, Neveda making it the 83rd bank to fail this year. The unofficial problem banks list published by Calculated Risk has increased to 781. Despite talks of economic recovery problem banks continues to rise.
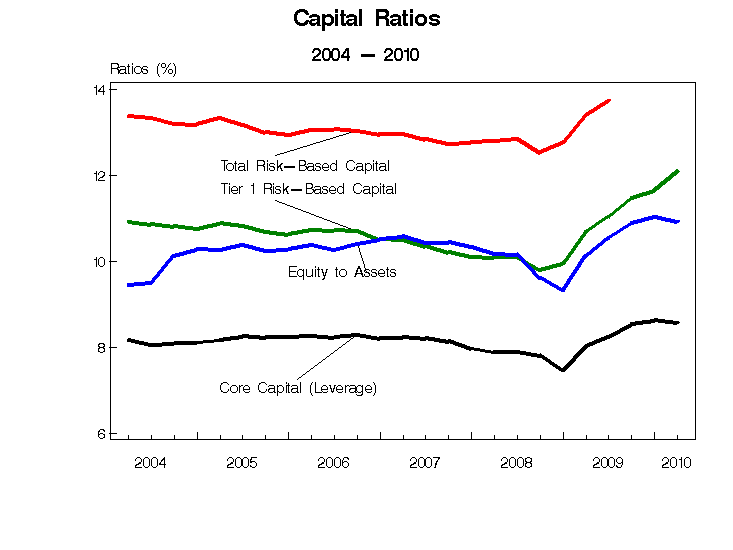
2. Capital Ratios of FDIC-insured institutions
The Tier 1 risk-based capital ratio is a bank’s core-equity capital to its total-risk weighted assets. It can be used to determine a bank’s ability to sustain future losses. This ratio has been steadily increasing for US banks since early 2009 as a result of the many bailouts.
Related definitions from the FDIC Site:
“Well Capitalized.” Total Risk-Based Capital Ratio equal to or greater than 10 percent, and Tier 1 Risk-Based Capital Ratio equal to or greater than 6 percent, and Tier 1 Leverage Capital Ratio equal to or greater than 5 percent.
“Adequately Capitalized.” Not Well Capitalized and Total Risk-Based Capital Ratio equal to or greater than 8 percent, and Tier 1 Risk-Based Capital Ratio equal to or greater than 4 percent, and Tier 1 Leverage Capital Ratio equal to or greater than 4 percent.
“Undercapitalized.” Neither Well Capitalized nor Adequately Capitalized.
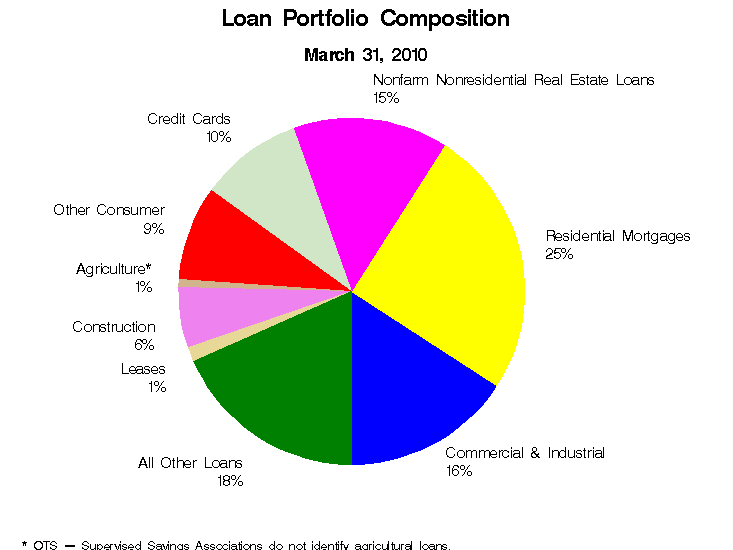
3. Loan Composition
The majority of the loans held by institutions are real estate loans while credit card loans account for 10% of total outstanding loans.
