Last week crude oil fell below $50 per barrel for the first time in over five years. The dramatic decline in oil prices since the middle of last year has been shocking to many investors.On Friday Brent for March delivery closed at $49.90 on the NYMEX.
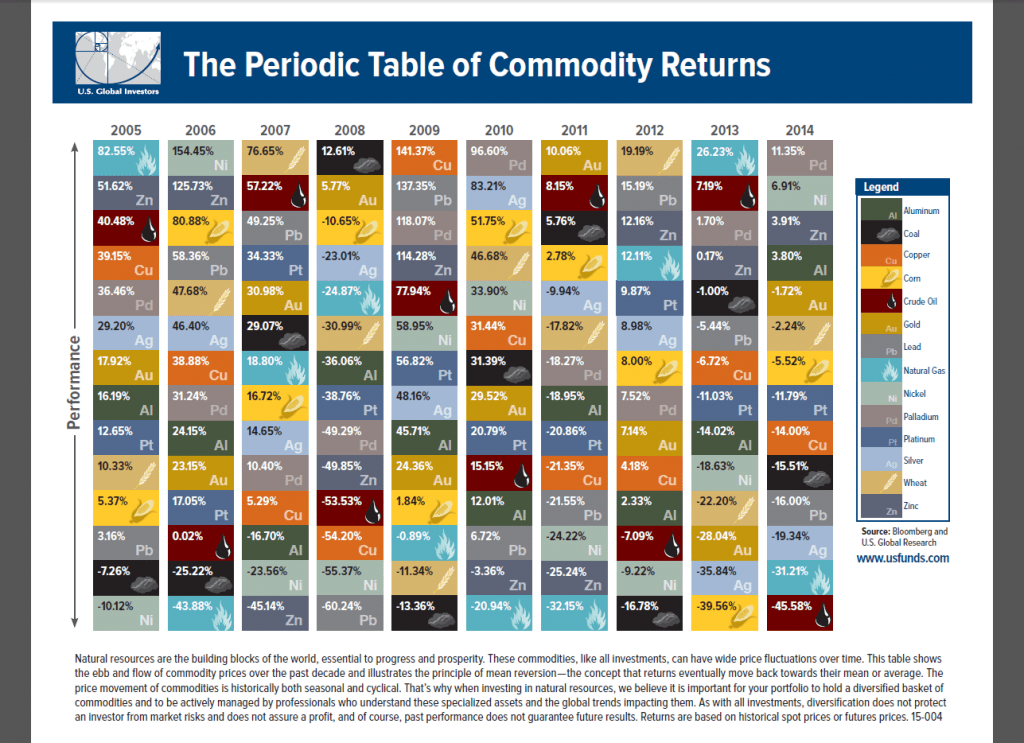
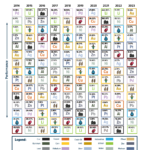
This is not the first time that oil has plunged by over 50% in a year as the following table of periodic table of commodities shows:
Click to enlarge
Source: US Funds
In 2014 oil fell by over 45%. But in 2008 it fell even more with a loss of over 53%. This occurred after double digit gains in the previous year and following the collapse in 2008 it soared nearly 78% in 2009. Another highly volatile but closely watched commodity is copper. Copper collapsed by over 50% in 2008 but shot up 141% the next year.
Related ETF:
- United States Oil ETF (USO)
Disclosure: No Positions
