Global commodity prices have been on a steady decline mode for the past few years. More recently, Crude Oil has plunged heavily just in the past few months. Today WTI crude for January delivery rose slightly and closed at $67.97 on the NYMEX.
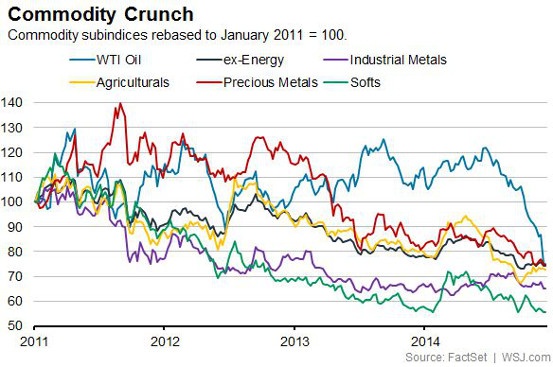
The following charts the decline and fall of some commodity prices:
Click to enlarge
Source: Can The Commodities Carnage Get Worse?, Moneybeat, WSJ ; Hat Tip: The Big Picture
From the Moneybeat post:
Losses on this year’s highs are marginal compared with the drop most of these classes of commodities have suffered from their peaks, generally hit in the spring of 2011.
Oil prices are down 42% from then–and down 53% from its all-time high in 2008. Softs are down 58% from the spring of 2011. Precious metals are down 47%. Industrials have lost 40%. Agriculturals are down 35%. Overall, non-energy commodities have tumbled a third from their April 2011 highs.
Commodities are generally volatile. Investing in commodities is not suitable for most retail investors. For example, the price of wheat can go up or down for any number of reasons including drought in one country to soaring production in Russia.The dramatic collapse of crude oil recently is another example. Global crude oil prices can fall for seemingly silly reason such as a team of rebels setting fire to a pipeline somewhere in Nigeria. A few years ago many oil investors were adversely impacted by the Contango effect.So retail investors should be cautious of investing in commodity stocks, ETFs and so on.
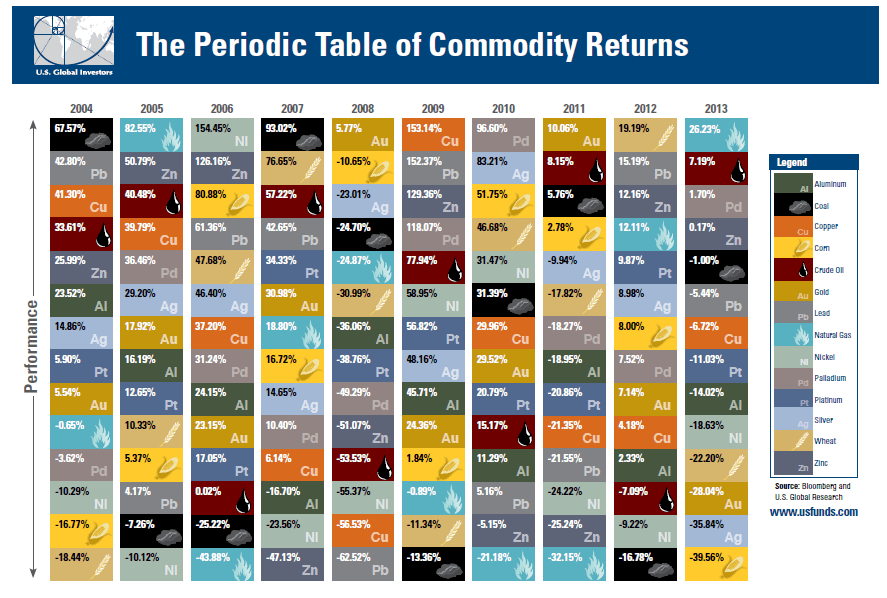
The Periodic Table of Commodity Returns 2004 To 2013:
Click to enlarge
Source:The Periodic Table of Commodity Returns For 2013, US Funds
A quick glance at the chart shows that the returns for pretty much every commodity is highly unpredictable from one year to the next.
