The chart below shows the total returns for major asset classes for the past 30 years from 1993 to June 2022 from an Australian market perspective. The chart again proves the importance of diversification. Only in rare occurrences, have the winning asset in one year is also the winner the following year.
Click to enlarge
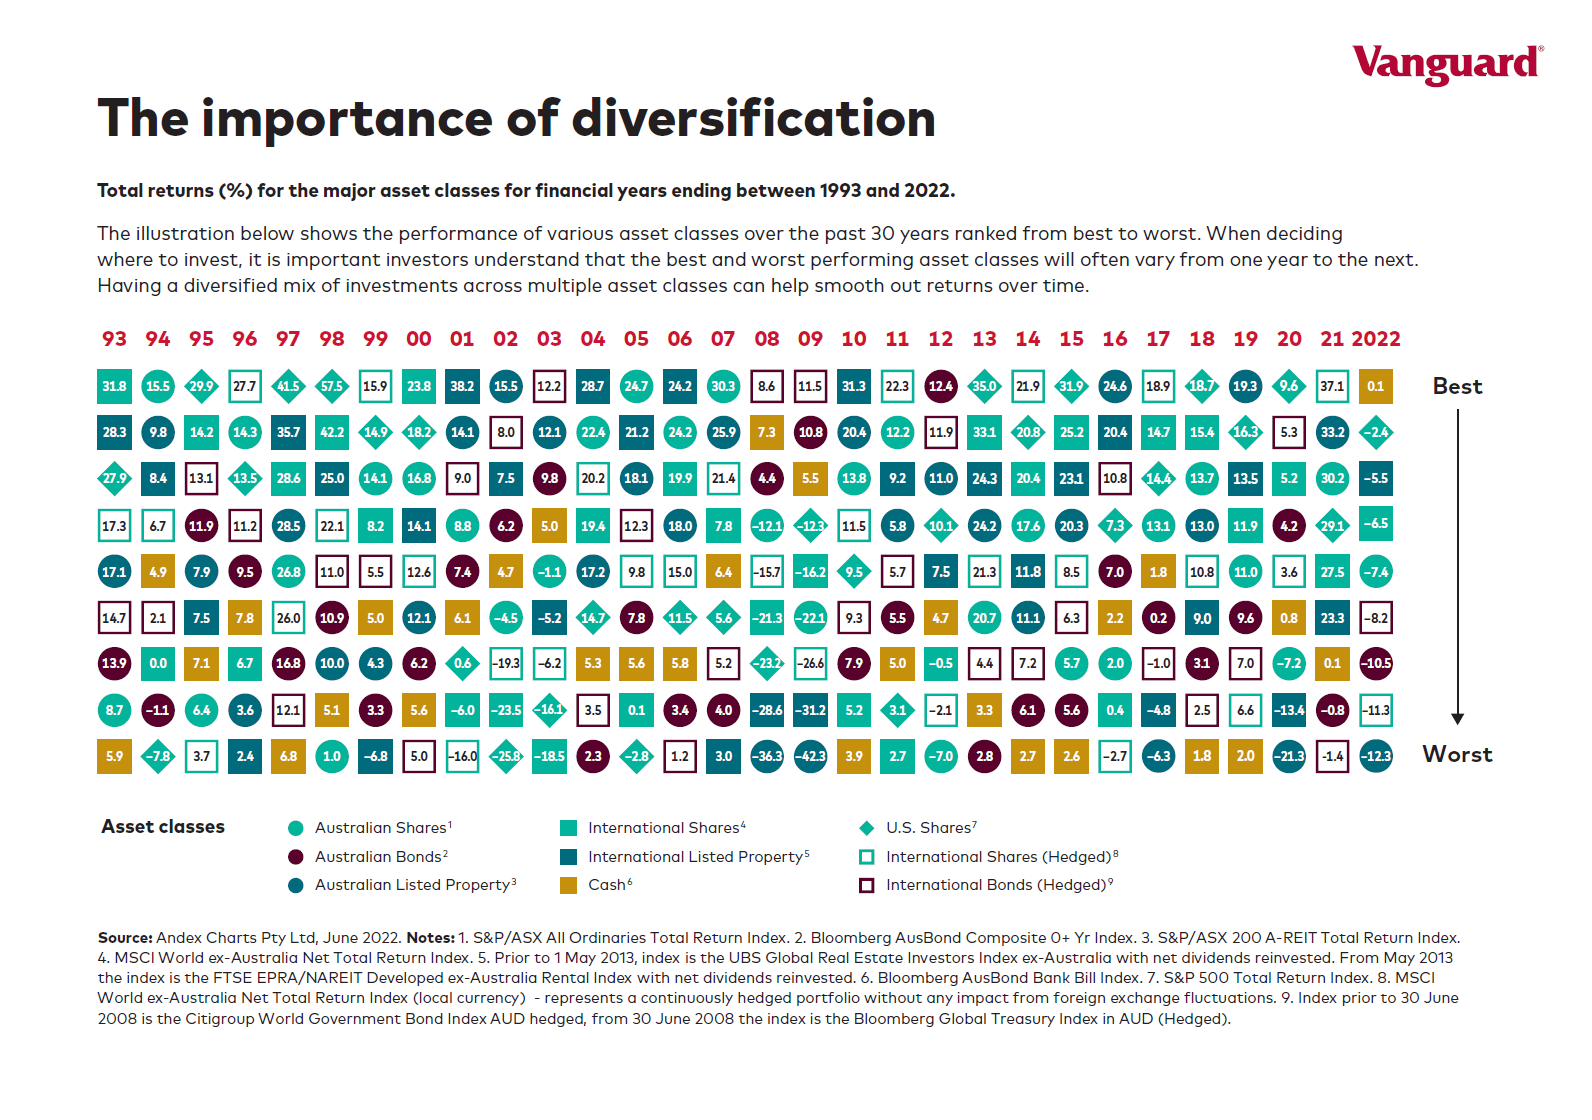
Note: Returns shown are in Australian currency and 2022 data is till June, 2022
Source: Vanguard Australia
Related :
- The Complete List of Australian ADRs
- iShares MSCI Australia ETF (EWA)
- SPDR S&P 500 ETF Trust (SPY)
Disclosure: No Positions