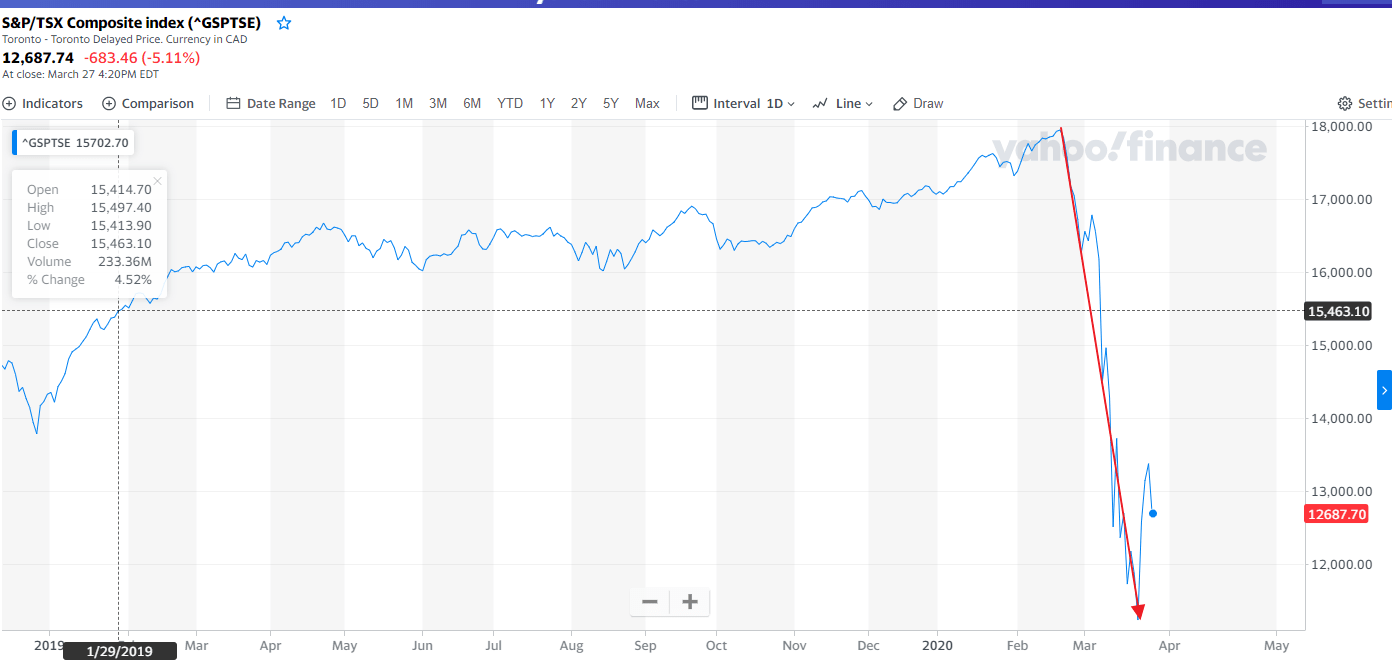
The S&P/TSX Composite Index is down about 26% year-to-date. However it was down much before the 19% jump in the index in 3 days last week. The index reach a peak of 17,970 in Feb. Then it plunged dramatically in just a few weeks all the way to 11,172. This was the worst sharp decline in Canadian stocks ever according to an article in MaClean’s. The chart below the recent collapse in the TSX index:
Click to enlarge
Source: Yahoo Finance
Below is an excerpt from the MaClean’s piece:
Simply put, we’ve never seen anything like this before.
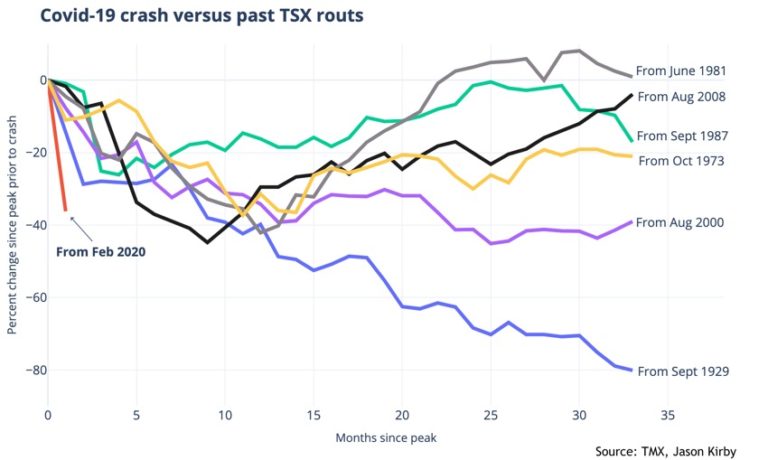
The chart uses monthly data for the Toronto Stock Exchange going back to the 1920s, and looks how how stocks performed relative to the peak prior to each crash. In additional to the current sharp downturn, illustrated in red, the other market crises included are the 2008 Great Recession, the collapse of the dot-com bubble, Black Monday in 1987, the 1981 recession, the oil shock of 1973 and the 1929 stock market crash. The chart covers 33 months, which was how long it took for Canadian stock prices to reach their lowest point after the 1929 crash.
As the chart shows, no crash has been as sharp and as deep as what we’re seeing now. To date more than $1 trillion has been wiped out from Canadian stocks as the S&P/TSX Composite Index tumbled by one-third since Feb 20. Circuit breakers put in place to calm panicked investors by halting trading when markets drop precipitously have triggered multiple times, yet markets have continued to fall. Even dramatic rate cuts by central banks, including the Bank of Canada, have failed.
Source: Canada’s stock market collapse is like nothing we’ve ever seen before, MaClean’s
Note: The above chart is before the 19% jump in the last week.
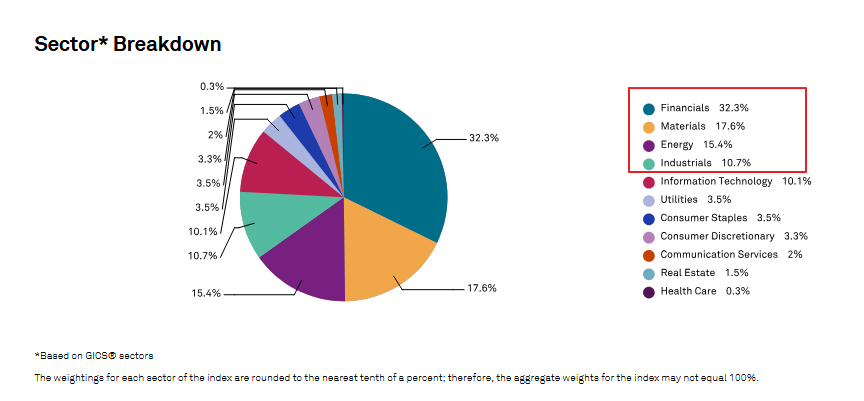
The TSX is dominated by oil, natural resources and financial sectors. As these sectors declined heavily in the past weeks the benchmark fell as well.
Related ETFs:
- The iShares MSCI Canada ETF (EWC)
Disclosure: No Positions
