The following inflation-adjusted chart shows the S&P 500 bull and bear markets from 1871 thru July, 2019. The US market as represented by the S&P 500 is in a secular bull market about 60% vs. about 40% in the bear market. Currently we are in a secular bull market which started in Mar-Apr 2009 at the trough of the global financial crisis.
Click to enlarge
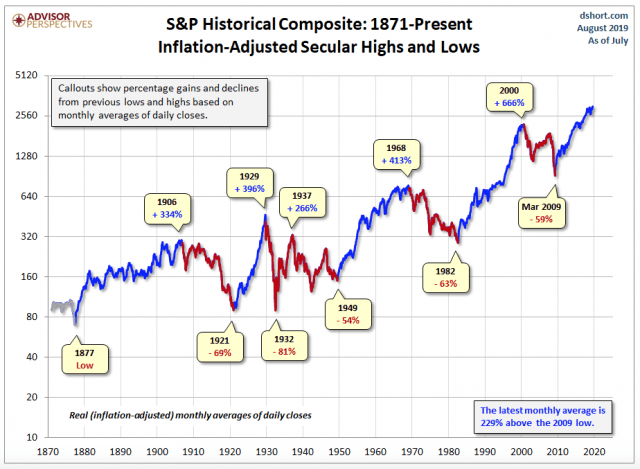
Source: Doug Short, dshort.com
Related ETF:
- SPDR S&P 500 ETF Trust (SPY)
Disclosure: No Positions


