Dollar Cost Averaging (DCA) is an investment strategy by which you invest little by little in each period instead of a lump sum in one shot. By investing small amounts say each month over many years one can reduce volatility and also the risk of heavy losses. Over time small amounts tend to benefit from the effect of compounding also. Similar to compound interest in the banking world, overall growth of amount invested over time will be higher with DCA as capital invested compounds over many months or years.
I recently across an article demonstrating the power of Dollar Cost Averaging by Frank Holmes of U.S. Global Investors. While he uses the below example to show the benefits of DCA there are two critical flaws in his demonstration. From the article:
What is does require, though, is discipline. Put a long-term plan in place and let compound interest work its magic.
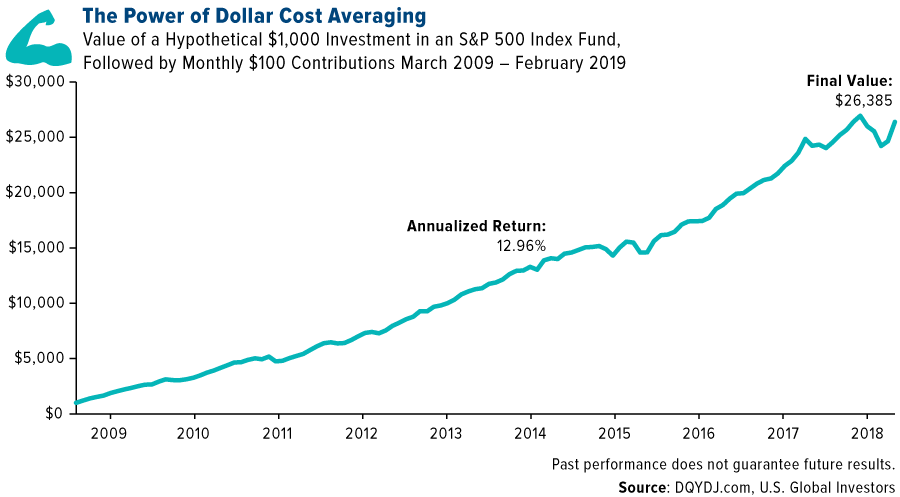
I’ve shared this chart with you before, but I think it’s worth sharing again. It shows a hypothetical initial investment of $1,000 in an S&P 500 Index fund in March 2009. Ten years later, after regular monthly contributions of only $100, the value of that initial investment grew at an annualized 12.96 percent to more than $26,385. Investors who had the discipline to stick with this plan and reinvest the dividends were rewarded handsomely.
Remember, the illustration above includes only the period during the 10-year bull market, and there’s no guarantee that the good times will continue.
But with dollar cost averaging, some of the guesswork involved in market timing is eliminated.
Remember, the illustration above includes only the period during the 10-year bull market, and there’s no guarantee that the good times will continue.
But with dollar cost averaging, some of the guesswork involved in market timing is eliminated.
Source: Retire Happy With Dollar Cost Averaging, U.S. Global Investors
I think there are two issues with the above example. One is cherry picking the time period. Selecting the lowest point of the Global Financial Crisis (GFC) of March 2009 as the starting point for the above chart is not the ideal way to prove the benefits of DCA. Hardly any retail investor would have had the foresight to start a long-term investment in March 2009 when it seemed like a depression was about to begin. Had the selected starting year was 1999 the result or the annual yield of the above chart would have been entirely not so great to say the least.
Another related issue is that the annualized return of 12.96% is very high because March 2009 was the starting point. Again achieving an average annual return of 13% is not an easy task. By simply selecting the bull market as the time period the annual return is high. This may give some investors the false idea that DCA an yield double digit returns easily.
The correct way to demonstrate the power of DCA is to use a time period that is long enough to include both bull and bear markets and not just a bull market alone. In addition, choosing the trough of a great bear market as the starting point also artificially inflates the benefits of DCA.
Regardless the key for investors to remember is that the best and easy way to save for retirement or some other long-term financial goal is to invest regularly even if it is a small amount and let the power of compounding do the trick. Investors should not fear bear markets and stop their periodic contributions.Instead it is important to have patience and focus on the long-term goal.


