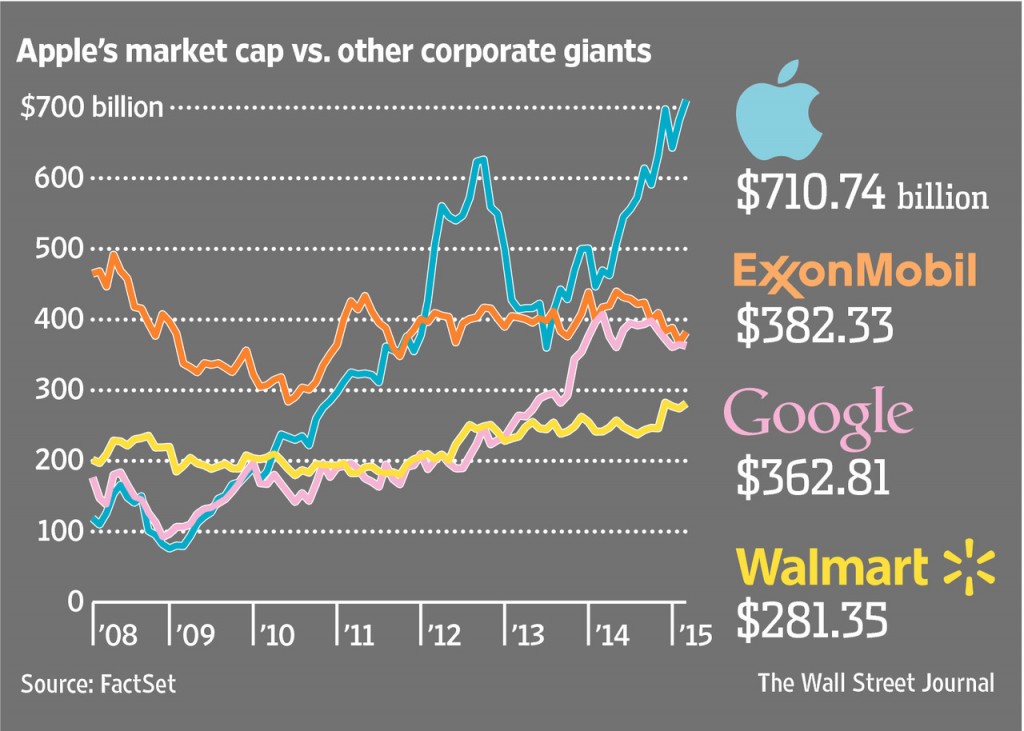
Apple Inc(AAPL) became the most valuable company in the world this Monday when its market cap exceed $710.0 billion. The next largest firms have market caps of less than $400 billion as the graphic shows below:
Click to enlarge
Source: Apple: $710 Billion and Counting, Feb 10, 2015, The Wall Street Journal
I was curious about the size of the large-cap foreign firms trading on the New York Stock Exchange. According to the latest data, drug giant Novartis(NVS) has the highest market cap at over $276 billion. The table below shows the list of foreign firms on the NYSE which have market capitalization of over $50 billion:
| S.No. | Company | Ticker | Market Capitalization (as of Feb 12, 2015) | Industry | Dividend Yield (as of Feb 12, 2015) |
|---|---|---|---|---|---|
| 1 | China Mobile Ltd. | CHL | $269.2B | Wireless Telecommunication Services | 3.05% |
| 2 | Novartis AG | NVS | $276.1B | Pharmaceuticals | 2.70% |
| 3 | Alibaba Group Holding Ltd | BABA | $213.9B | Internet & Catalog Retail | -- |
| 4 | Toyota Motor Corp | TM | $220.8B | Automobiles | 2.46% |
| 5 | Anheuser Busch Inbev SA | BUD | $195.9B | Beverages | 2.67% |
| 6 | HSBC Holdings plc | HSBC | $173.6B | Banks | 5.39% |
| 7 | Sanofi SA | SNY | $127.7B | Pharmaceuticals | 3.97% |
| 8 | Royal Dutch Shell plc | RDS.A | $211.2B | Oil, Gas & Consumable Fuels | 5.82% |
| 9 | Taiwan Semiconductor Mfg. Co. Ltd. | TSM | $121.6B | Semiconductors & Semiconductor Equipment | 2.06% |
| 10 | BP plc | BP | $124.0B | Oil, Gas & Consumable Fuels | 5.95% |
| 11 | Total SA | TOT | $126.4B | Oil, Gas & Consumable Fuels | 5.70% |
| 12 | GlaxoSmithKline plc | GSK | $112.3B | Pharmaceuticals | 5.62% |
| 13 | Banco Santander, S.A. | SAN | $95.2B | Banks | 11.91% |
| 14 | Westpac Banking Corp | WBK | $88.7B | Banks | 5.59% |
| 15 | Novo Nordisk A/S | NVO | $90.3B | Pharmaceuticals | 1.79% |
| 16 | AstraZeneca plc | AZN | $86.5B | Pharmaceuticals | 4.09% |
| 17 | SAP SE | SAP | $82.3B | Software | 2.04% |
| 18 | Mitsubishi UFJ Financial Group Inc | MTU | $81.1B | Banks | 4.00% |
| 19 | Lloyds Banking Group PLC | LYG | $81.0B | Banks | -- |
| 20 | BHP Billiton Limited | BHP | $124.7B | Metals & Mining | 5.05% |
| 21 | Diageo plc | DEO | $72.3B | Beverages | 2.92% |
| 22 | Telefonica S.A. | TEF | $68.3B | Diversified Telecommunication Services | 5.99% |
| 23 | NTT Docomo Inc | DCM | $74.9B | Wireless Telecommunication Services | 4.89% |
| 24 | Rio Tinto plc | RIO | $84.3B | Metals & Mining | 4.42% |
| 25 | Nippon Telegraph & Telephone Corp | NTT | $69.0B | Diversified Telecommunication Services | 2.73% |
| 26 | Barclays PLC | BCS | $63.2B | Banks | 3.20% |
| 27 | Eni SpA | E | $62.1B | Oil, Gas & Consumable Fuels | 8.53% |
| 28 | Prudential Public Limited Company | PUK | $63.1B | Insurance | 3.00% |
| 29 | CNOOC Ltd | CEO | $62.3B | Oil, Gas & Consumable Fuels | 5.28% |
| 30 | Statoil ASA | STO | $59.3B | Oil, Gas & Consumable Fuels | 9.34% |
| 31 | Honda Motor Co Ltd | HMC | $57.8B | Automobiles | 2.52% |
| 32 | Banco Bilbao Vizcaya Argentaria SA | BBVA | $56.6B | Banks | 5.91% |
| 33 | BT Group plc | BT | $57.1B | Diversified Telecommunication Services | 2.57% |
| 34 | Unilever plc | UL | $127.6B | Food Products | 3.43% |
| 35 | Teva Pharmaceutical Industries Ltd | TEVA | $54.9B | Pharmaceuticals | 2.37% |
| 36 | Unilever N.V. | UN | $127.6B | Food Products | 3.49% |
| 37 | ING Groep NV | ING | $50.7B | Diversified Financial Services | -- |
| 38 | China Telecom Corporation Limited | CHA | $50.4B | Diversified Telecommunication Services | 1.95% |
| 39 | National Grid plc | NGG | $51.4B | Multi-Utilities | 5.08% |
Note: ING resumed paying dividends after a break of many years and will pay 12 Euro cents this year.
Just a handful of firms have market caps exceeding $200 billion and most firms have market caps under $100 billion. Many of the oil firms listed here have lost substantial market values in the past few months. Others like Petrobras(PBR) of Brazil do not even appear in this list as it is valued at under $25 billion now.
Disclosure: Long LYG, PBR, ING
