With the election over, the U.S. is now currently bogged in the over-hyped political issue called the “fiscal cliff“. We can expect the media to focus on this political drama as the lead story for the rest of the year.
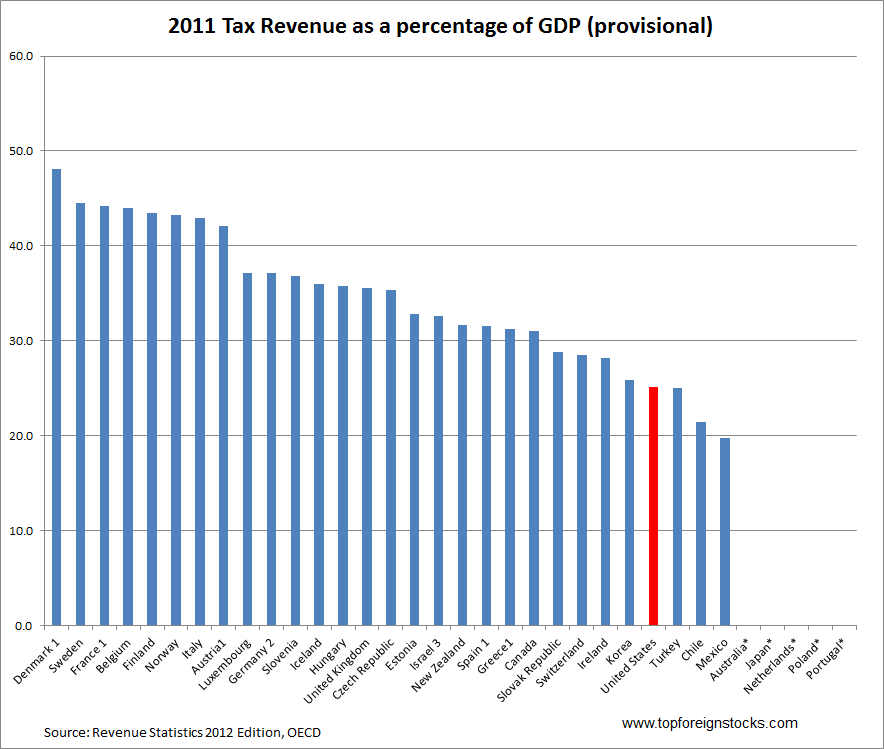
An important measure to describe a country’s finances is the measure of tax receipts, the revenues that a government collects each year. While the U.S. has the largest economy in the world, the country has one of the lowest tax revenue to GDP ratio among the OECD countries.
Tax Revenue as a percentage of GDP 2000 to 2011:
Click to enlarge
Note:
* indicates not available.
1. The total tax revenues have been reduced by the amount of any capital transfer that represents uncollected taxes.
2. Unified Germany beginning in 1991.
3. The data for Israel are supplied by and under the responsibility of the relevant Israeli authorities. The use of such data by the OECD is without prejudice to the status of the Golan Heights, East Jerusalem and Israeli settlements in the West Bank under the terms of international law.
4. Secretariat estimate, including expected revenues collected by local governments.
5. Secretariat estimate, including expected revenues collected by state and local governments.
Source: OECD
Tax revenues as percentage of GDP rose from 33.8% in 2010 to 34.0% in 2011 for OECD countries. This is still below the recent peak of 35.0% reached in 2007.
During the period noted the U.S. figure was well below the OECD average. In 2010, the U.S. measure was 24.8% compared to the OECD average of 33.8%.
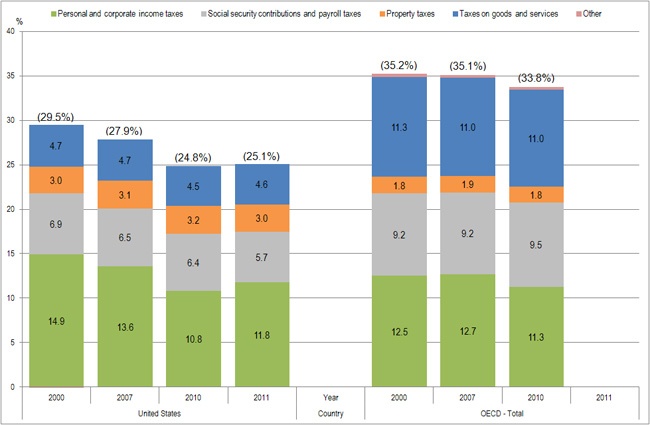
U.S. Tax Revenue main headings as percentage of GDP in select years
Source: OECD
The OECD made the following observations:
Revenue from personal and corporate income taxes was 14.9% of GDP in 2000 and 11.8% in 2011. The 2010 figure was 10.8%, just below the OECD average of 11.3%.
The tax ratio for Social security contributions was 6.9% of GDP in 2000 and 5.7% in 2011. The 2010 figure of 6.4% was well below the OECD average of 9.5%.
The tax ratio for Taxes on goods and services was 4.7% of GDP in 2000 and 4.6% in 2011. The 2010 figure of 4.5% was well below the OECD average of 11.0%.
Property tax revenues were 3.2% of GDP in 2010, more than 50% above the OECD average of 1.9%.
It is interesting to note that while the U.S. ranks below the OECD average in personal and corporate income taxes, social security contributions and taxes on goods and services, in property tax revenues the U.S. figure is 50% higher then OECD average. This is not surprising since most average Americans complain about out-of-control property taxes all the time. Property taxes are controlled by local politicians and they operate it as a piggy back to fund all kinds of useless projects such as funneling millions of dollars to powerful well-connected individuals to build stadiums for sports activities. According to one Bloomberg report on this ongoing scam across the country, U.S. tax payers are projected to lose $4 billion. Another reason for high property tax revenues in the U.S. is that unlike the Federal government, local governments cannot print money when needed to fund all the pork belly projects. Hence the easiest way is to simply raise property taxes which can bring in millions even with a tiny percentage increase.


