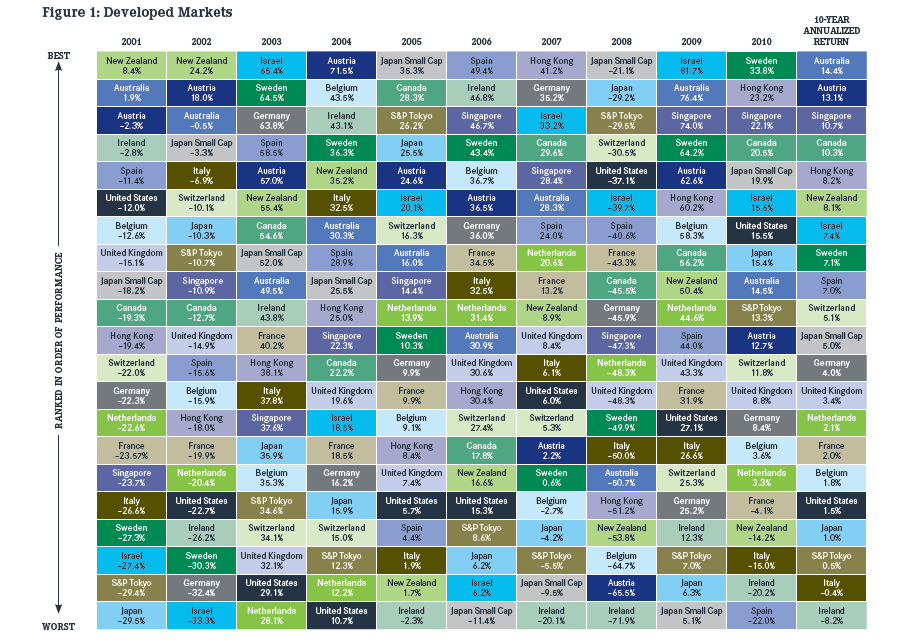
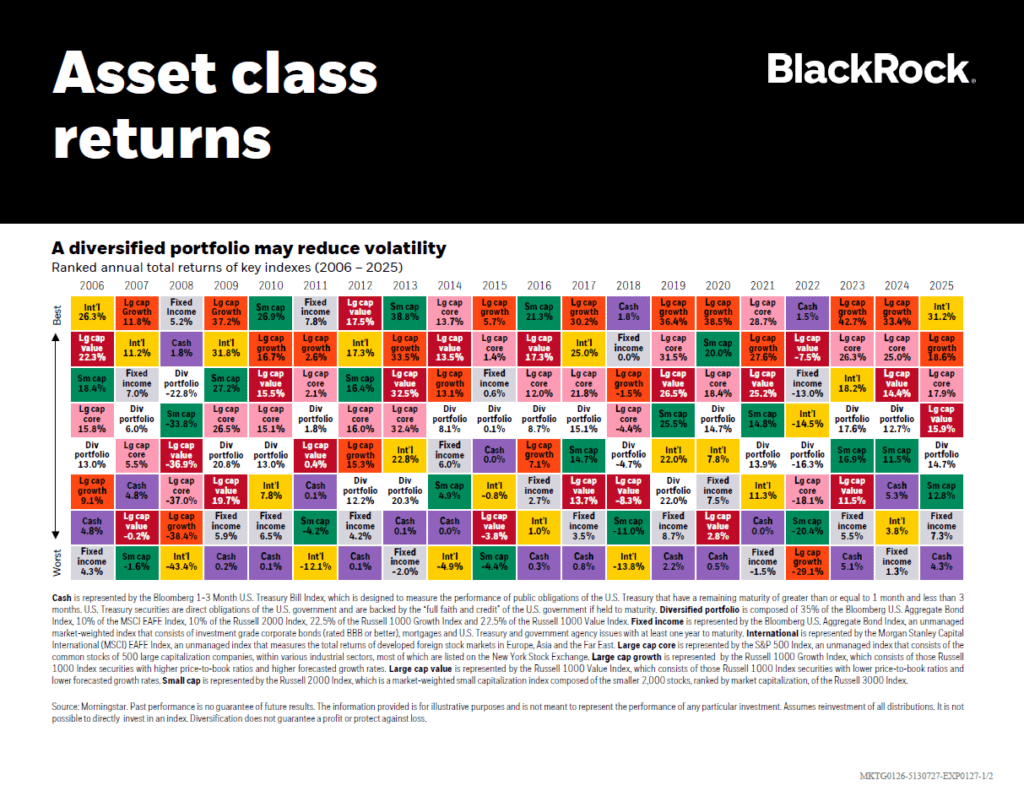
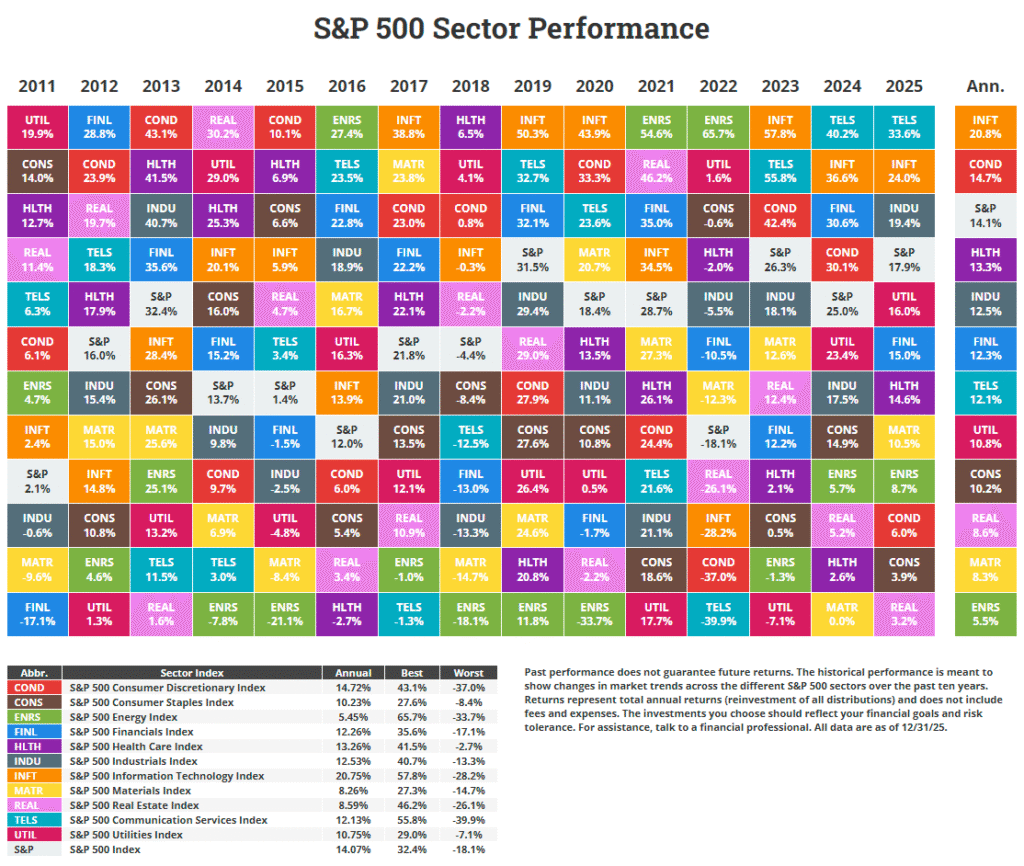
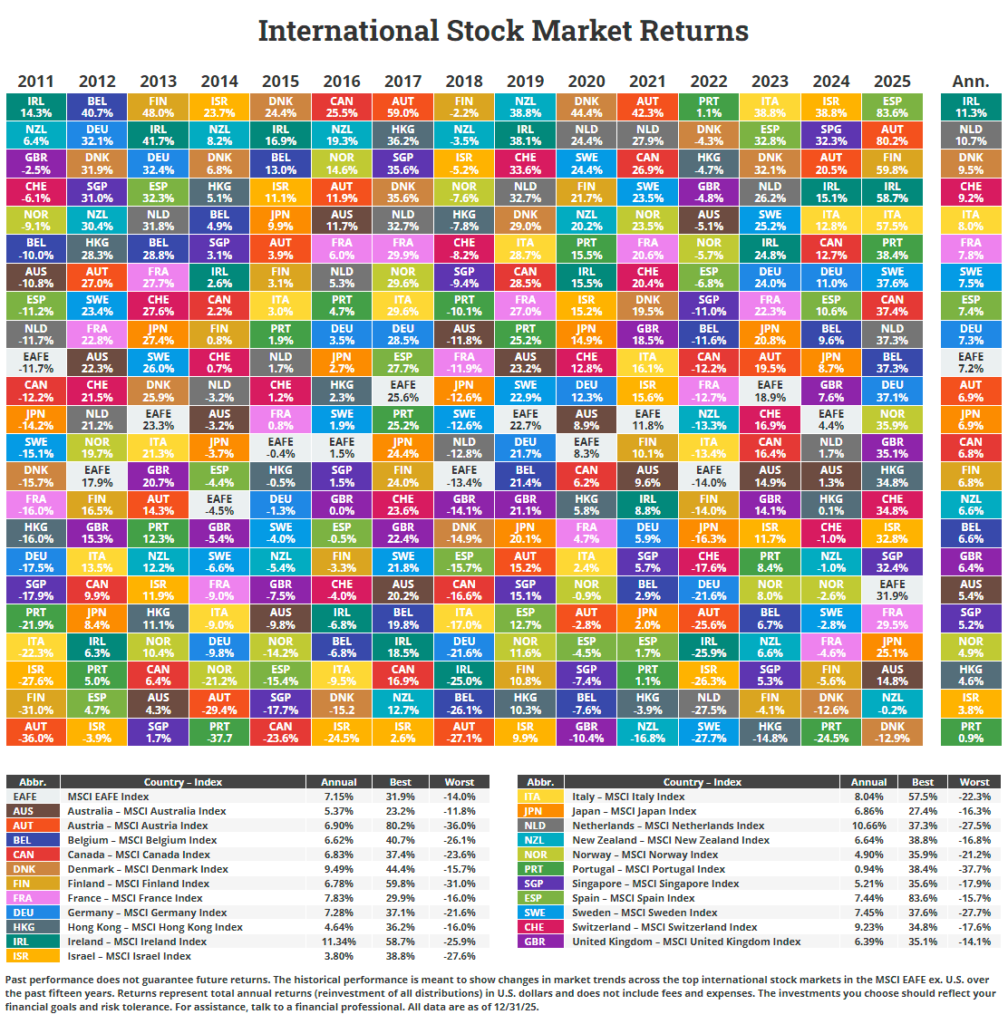
The chart below shows the Periodic Table of Investment Returns for individual countries in the developed world from 2001 to 2010. The returns are based on the MSCI and Standard & Poor’s data.
Source: iShares
A few interesting observations:
- Australia was one of the best performing markets for the period shown with double digit returns in most years.Though Australia fell over 50% in 2008 due to the global financial crisis (GFC), in 2009 and 2010 it had double digit returns. In addition, the 10-year annualized return is 14.4%.
- The U.S. return was average to below average in the 10 years when compared with other developed markets like Israel, Australia, Germany.The 10-year annual return for the U.S. is just 1.5% which is lower than all European countries except Ireland and Italy, Singapore and Australia.
- Singapore is also a top performing market yielding returns of more than 10% except in 2008 and a couple of other years.
- Though Canada and Australia have similar economies, Canada lagged Australia in performance during the period shown.
Related ETFs:
iShares MSCI Canada Index (EWC)
iShares MSCI Australia Index (EWA)
iShares MSCI Germany Index Fund (EWG)
iShares MSCI Singapore Index Fund (EWS)
SPDR S&P 500 ETF (SPY)
Disclosure: No Positions
