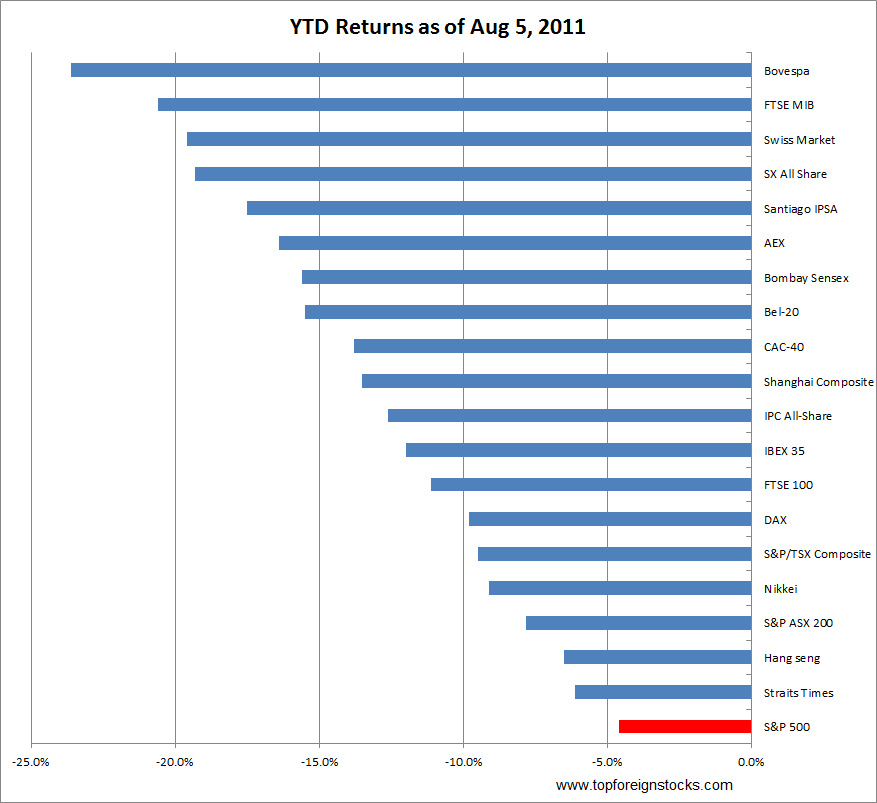
The chart below shows the year-to-date(YTD) performance of the S&P 500 and the major indices of most global markets:
Click to enlarge
Some observations:
- With a loss of 4.6% YTD for the S&P 500, U.S. stocks are relatively performing better than the stocks of other developed economies.
- Equities in Italy and Spain have entered the bear market territory as the FTSE MIB and Bovespa indices are off by more than 20% YTD.
- Germany, home of the largest and strongest economy in Europe, is down by 9.8% as noted by the DAX index compared to double digit losses of the British, French, Spanish, Swiss indices.
- In addition to Brazil, the emerging countries of India(Bombay Sensex) and China(Shanghai Composite) are also down more than 10% YTD.
- The commodity-based developed economies of Canada (S&P/TSX Composite) and Australia (S&P ASX 200) are off more than the U.S. but still lower than the crisis-ridden European countries.
Related ETFs:
iShares MSCI Canada Index (EWC)
iShares MSCI Australia Index (EWA)
SPDR S&P 500 ETF (SPY)
iShares MSCI Emerging Markets Indx (EEM)
iShares S&P India Nifty 50 (INDY)
iShares FTSE/Xinhua China 25 Index Fund (FXI)
iShares MSCI Brazil Index (EWZ)
Disclosure: No Positions

