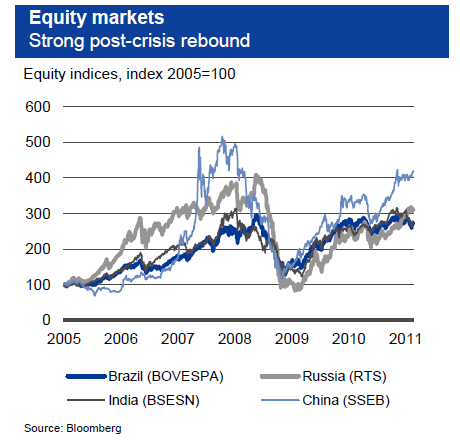
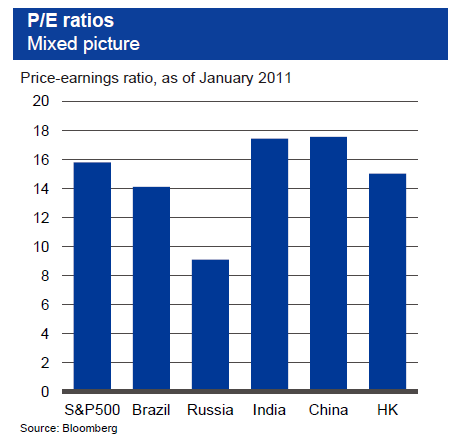
The equity markets markets of BRIC countries are not soaring this year.Brazil and India are down while China and Russia are up YTD compared to S&P’s fall of 1.90%. However the economies of BRICs continues to be strong and their growth is projected to outpace that of developed countries this year as well.
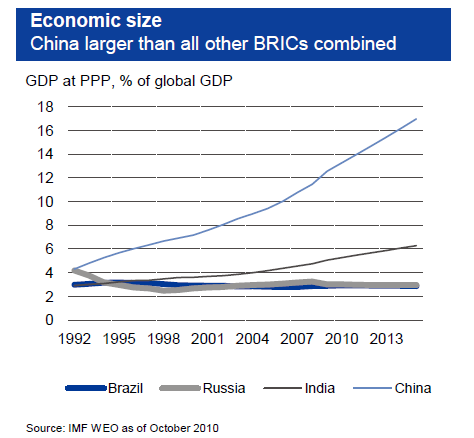
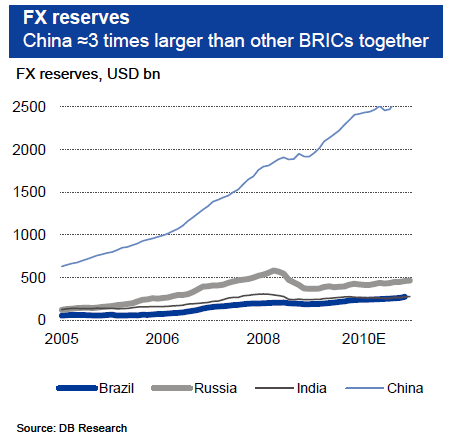
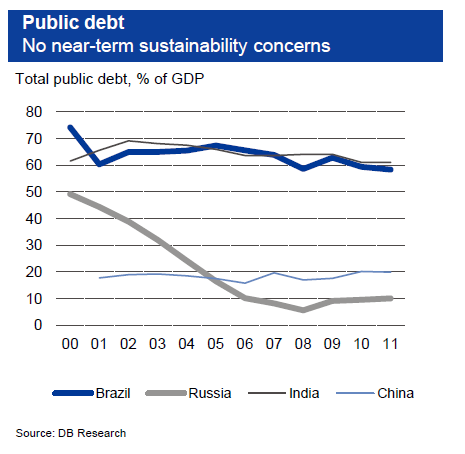
Deutsche Bank’s Research projects real GDP growth of 4.5%, 5.5%, 8.2% and 9% for Brazil, Russia, India and China respectively for 2011.The current weakness in BRIC equities offers an opportunity for investors looking to gain exposure to these countries. Some of the positive factors of the BRIC countries include strong Foreign Direct Investment (FDI) flows, low government debt, large balance-of-payments surpluses, lower labor costs, rising middle class, high foreign exchange reserves, etc.
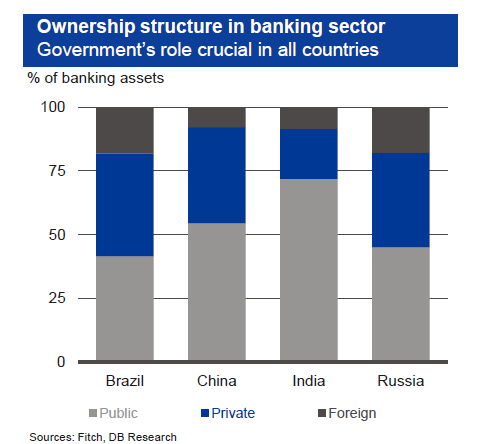
The following eight charts offer some insight into the BRIC economies:
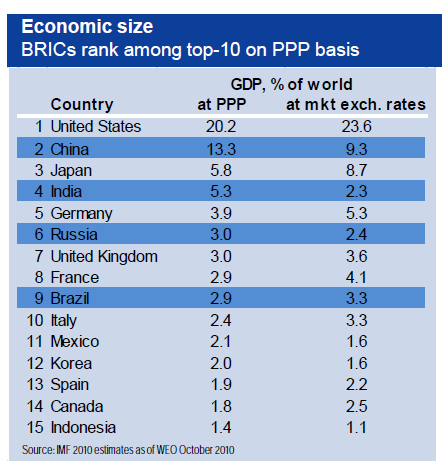
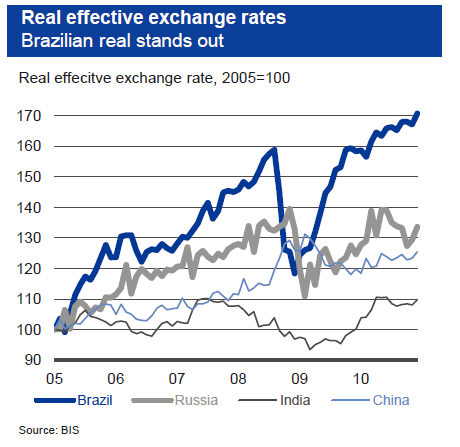
Source: BRIC Capital Markets Monitor, February 2011, Deutsche Bank Research
Related ETFs:
WisdomTree India Earnings (EPI)
PowerShares India (PIN)
iShares S&P India Nifty 50 (INDY)
iShares MSCI Emerging Markets Indx (EEM)
EGShares Brazil Infrastructure ETF (BRXX)
iShares MSCI Brazil Index (EWZ)
Market Vectors Russia ETF (RSX)
iShares FTSE/Xinhua China 25 Index Fund (FXI)
Disclosure: No Positions