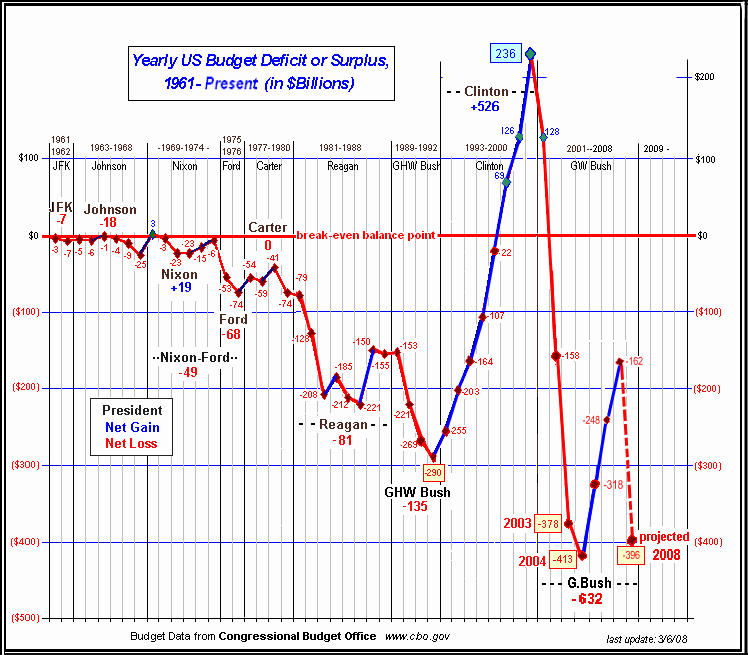
The U.S. has posted budget deficits year after year except for a brief period in the 1960s and between 1998 and 2001. One of the reasons for this shortfall is that the Federal government’s revenue is not keeping up with the rising expenditures. Among the expenditures, I believe the most important one to concentrate on is the federal handouts to individuals.
In economic terms, the handouts are called “current transfer payments”. These types of handouts include social security, welfare benefits such as medicare, medicaid, etc. Transfer payments can also be called, redistribution of income since it is the portion of government expenditure that is simply transferred to individuals without a requirement to provide anything in exchange. The current receipts represent the total Federal revenue such as income tax, payroll taxes, corporate income taxes, etc.
Chart 1 – Yearly US Budget Surplus/Deficit
Click to Enlarge
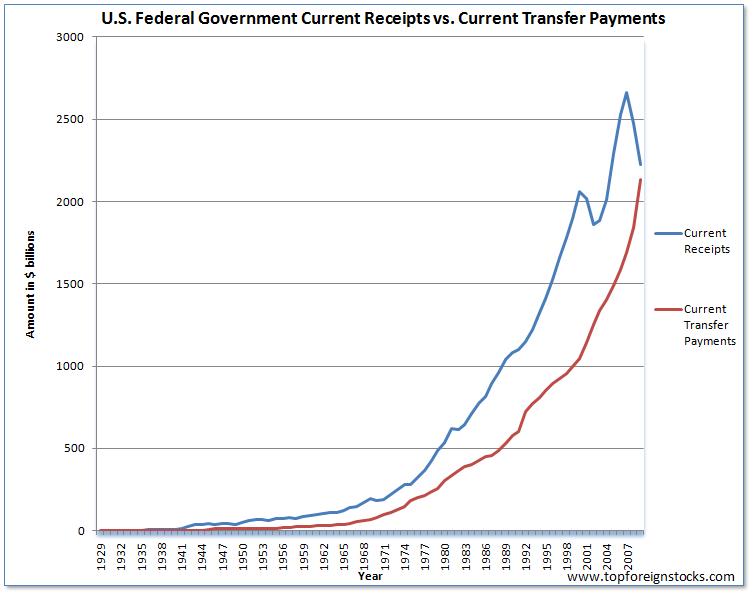
Chart 2: U.S. Current Receipts vs. Current Transfer Payments from 1920 to 2009
Click to Enlarge
Source: BEA NIPA Table 3.2
The chart above shows that in 2007, current receipts started to decline sharply. However the current transfer payments rose sharply due to the great recession forcing many people to seek benefits, rising medicare and medicaid costs, the extensions of unemployment benefits, etc. As millions of workers lost jobs government revenues declined due to the reduction in income taxes collected.
In 2008, the current receipts was $2,475Â billion and the current transfer payments was $1,840 billion or 74% of revenue. This number jumped to a staggering 96% in 2009. In addition, the current receipts in 2009 fell to $2,226 billion from $2,475 billion in 2008. The sharp fall in revenue may continue for a few years due to stagnant income levels and high unemployment.
The creation of social security, medicare, and other income redistribution programs by the Feds, have accelerated government expenditures. For example, in 1929 transfer payments were just 22% and in 1950 it accounted for 31% of revenues. However in 1990, it was almost half of revenues at 49%. Last year it reached 96%.
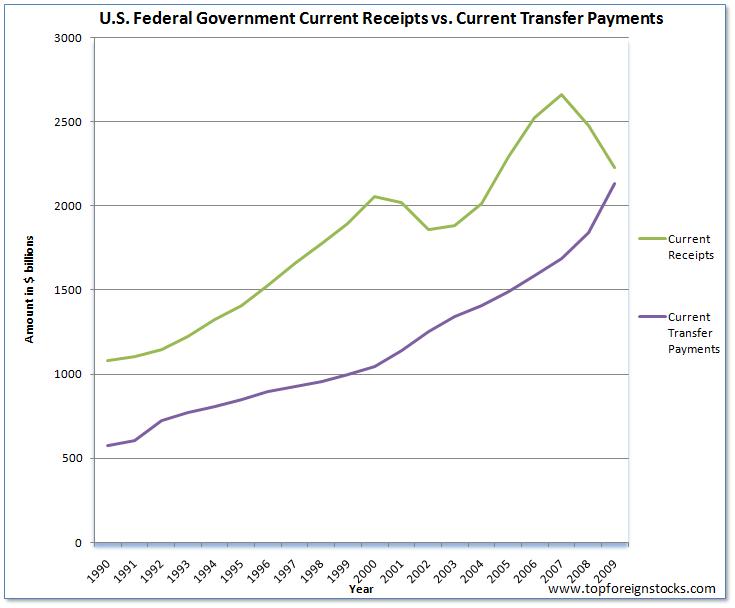
Chart 3: U.S. Current Receipts vs. Current Transfer Payments from 1990 to 2009
Click to Enlarge
The chart above shows that since 1990, though the current revenue increased due to economic growth, federal handouts also increased steadily. When the dot com bubble burst there was a dip in the revenues but payments continued the onward march. If the revenues do not increase and transfer payments continue to climb then the budget deficit would widen dramatically. In April, the U.S. posted the 19th straight month of deficit at $82.69 billion deficit. The total deficit for this year is projected to $1.5 trillion on top of the $1.4 Trillion deficit last year. So it is imperative that the Obama administration stimulate economic growth leading to higher tax collections and implement sensible policies to reduce wasteful expenditures and limit soaring healthcare costs.
