The S&P 500 is down 7.50% as of market close today (April 6,2009). The worst performing sectors is the financials at 24.7% and the best performing sector is IT with a return of 9.98%. Traditional defensive sectors such as utilities and consumer staples are down 11.11% and 8.25% respectively year-to-date.
The current bear market is the worst market since the great depression. Since the start of the credit crunch in October,2007 the S&P fell to a low of 56.8%. This is worse than the dot com bubble crash when the index was down 49.1% only.However during the great depression, the Dow index was off a horrendous 89.2%.The current crash is also worst than the 1973 oil crisis crash when the S&P was down 48.2%. From a trough of being down around 57%, the S&P has rallied some basis points in the past four weeks (Data Source: dshort.com)
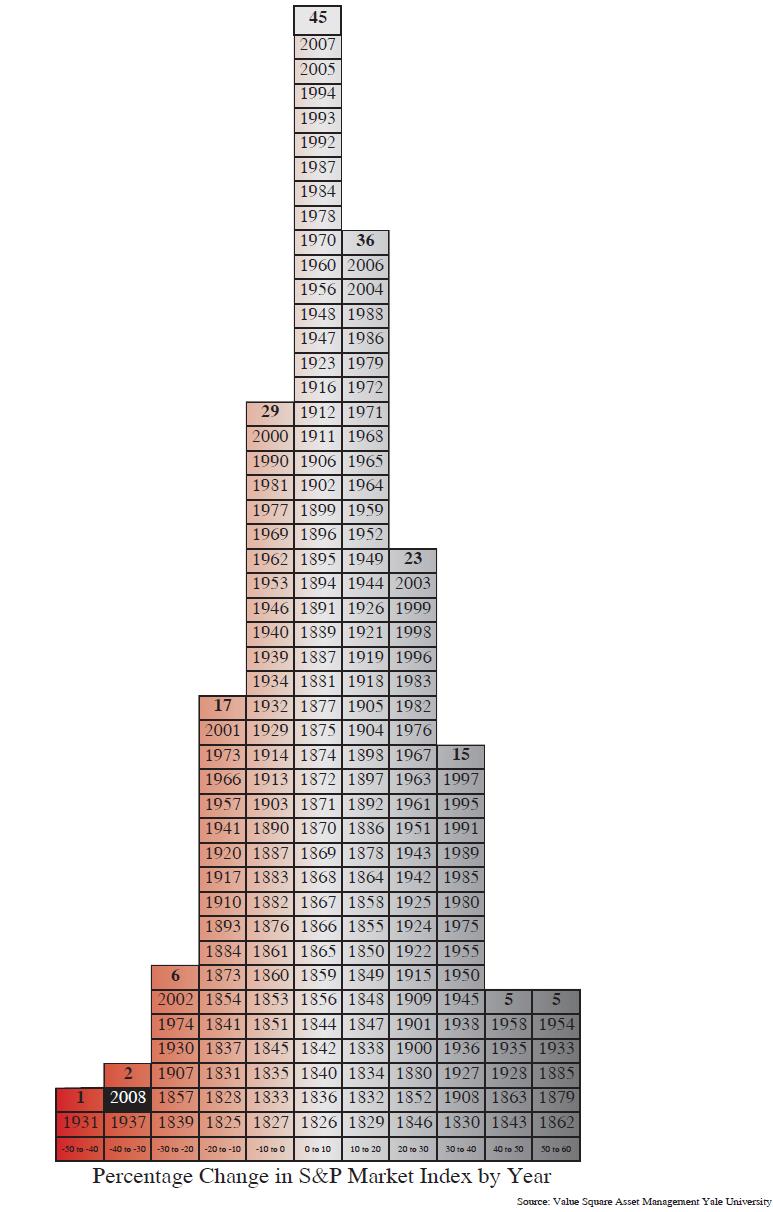
The following chart was developed by Yale University’s Value Square Asset Management. It shows the % change in S&P each year. It is not clear how data for 1800s were found and used (click to enlarge)