Market timing is extremely hard and is not a wise strategy for most investors. Equity markets decline and rise for all types of reasons and with no warning. In addition, the falls can be dramatic and shocking within a short period of time but equally dramatic are the violent gains that follow plunges. So the key to long-term investing success is to be patient and avoid getting caught in the chaos and selling out with the hope of buying back at a cheaper price later. Even though markets can fall in any given year, intra-year declines tend to be overridden with gains yielding a net gain in most years. The above scenario is true with most markets.
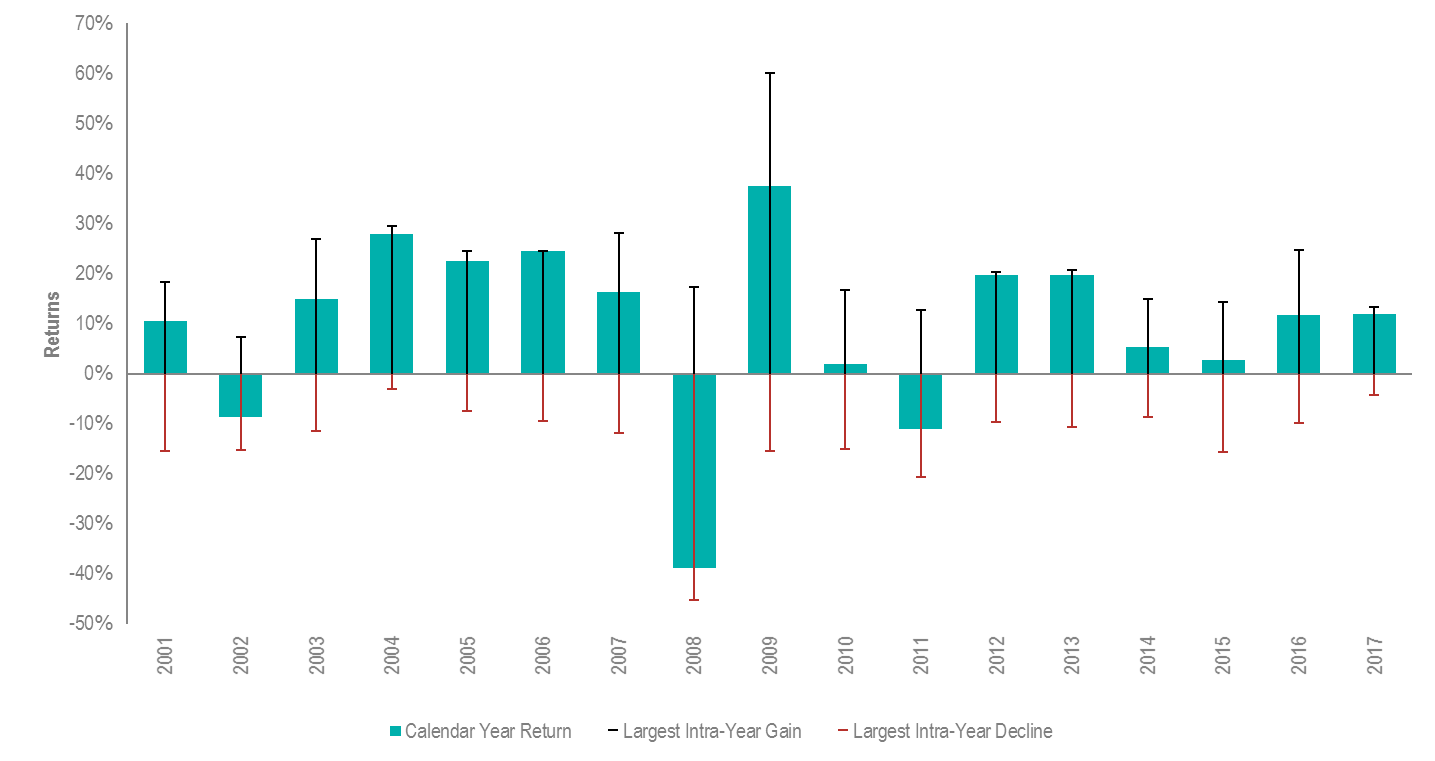
The following chart shows the Intra-Year Gains and Declines vs. Calendar Year Returns from 2001 to 2017 for the Australian stock market:
Click to enlarge
Source: VOLATILITY – 8 SIMPLE LESSONS, Stewart Partners
From the article:
Market timing is hard.
Recoveries can come just as quickly and just as violently as the prior correction. In 2008, the Australian share market fell by nearly 40%. Some investors capitulated, only to see the market bounce by more than 37% in 2009 and rise in seven of the eight subsequent years. The lesson is that attempts at market timing risk turning paper losses into real ones and paying for the risk without waiting around for the recovery.
The graph below shows calendar year returns for the Australian stockmarket since 2001, as well as the largest intra-year falls that occurred each year. During this 17 year period, the average intra-year decline was 13%. About 60% of the years observed had falls of more than 10%, and about 40% had falls of more than 15%. But despite substantial intra-year falls, calendar year returns were positive in 14 out of the 17 years examined.
Related ETF:
- iShares MSCI Australia Index Fund (EWA)
Disclosure: No Positions