Crude oil prices plunged by 46% in 2014. Yesterday oil futures for February delivery closed at $53.37 a barrel on the NYMEX. Gasoline prices have followed crude oil and have declined dramatically in the past few months and is now selling for less than $2.0 a gallon.
The chart below compares U.S. oil production to imports from 2973 to 2013:
Click to enlarge
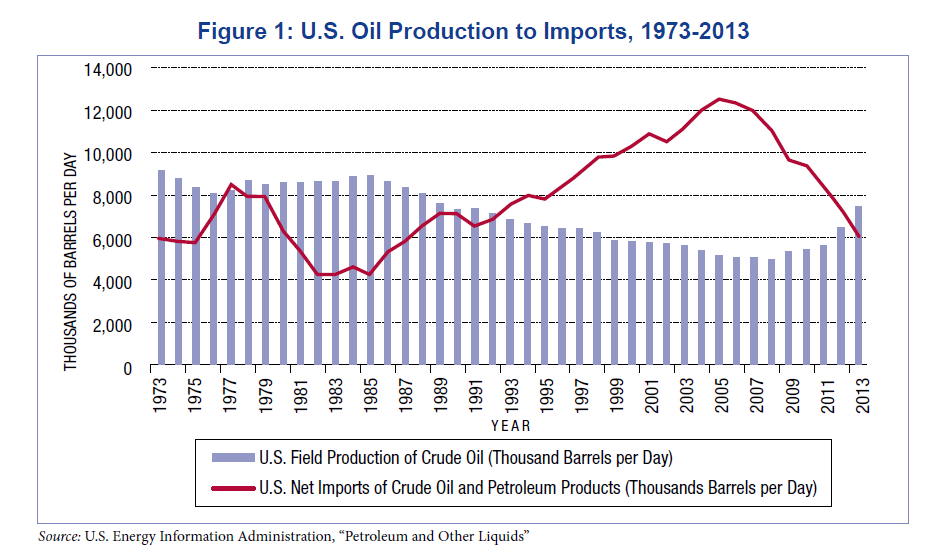
Source: Changing Markets Economic Opportunities from Lifting the U.S. Ban on Crude Oil Exports by Charles Ebinger and Heather L. Greenley, September 2014, The Brookings Institution
From 1980s tru 2006, U.S. production of oil declined steadily.However from 2008 production has consistently increased even as imports of crude oil and related products fell after peaking in 2005.
U.S. oil producers increased production as oil prices continued to stay high in the past few years. Since prices are down by about half it remains to been if many of these producers reduce or shut down their operations.It is highly likely that some of the smaller producers may go bankrupt unlike the major integrate firms like ExxonMobil(XOM), Chevron(CVX), etc.
Oil production in the U.S. rose by nearly 2.5 million barrels per day from 2008 to 2013 from shale and convention sources. From an article today in Bloomberg:
Crude Production
Crude production accelerated to 9.14 million barrels a day through Dec. 12, the fastest rate in weekly data that started in January 1983, EIA data show. It was 9.12 million last week.
“The real story is the shale revolution and the fact that Saudi Arabia, the 500-pound gorilla, refuses to be the one to make the cut to support prices,” said Tariq Zahir, a New York-based commodity fund manager at Tyche Capital Advisors. “Everyone is fighting for market share here.”
OPEC, which pumps about 40 percent of the world’s oil, produced 30.24 million barrels a day in December, according to a Bloomberg survey, down from 30.36 million in November. The group decided to maintain its output quota at 30 million barrels a day at a Nov. 27 meeting in Vienna.
“In the near term, and by that I mean 30 to 60 days, crude will be under a lot of pressure,” Dan Heckman, Kansas City, Missouri-based national investment consultant at U.S. Bank Wealth Management, said by phone. His firm oversees about $120 billion. “It will take time to work off this inventory glut.”
Source: Oil Caps Biggest Yearly Slump Since 2008 Amid Supply Glut, Jan 1, 2015, Bloomberg
From an investment perspective it is wise to stay away from small oil companies and nibble at major players as stock prices have declined strongly in recent months.
Related ETF:
- United States Oil ETF (USO)
Disclosure: No Positions