The U.S. population as of Mar 9, 2013 is 315,462,878 according to the POPClock by the U.S. Census Bureau. The World population as of the same date is 7,071,147,165.
Some interesting facts on the U.S. population provided by the Census Bureau:
- White persons, percent, 2011: 78.1%
- Black persons, percent, 2011: 13.1%
- American Indian and Alaska Native persons, percent, 2011: 1.2%
- Asian persons, percent, 2011: 5.0%
- Native Hawaiian and Other Pacific Islander persons, percent, 2011: 0.2%
- Persons reporting two or more races, percent, 2011: 2.3%
- Persons of Hispanic or Latino Origin, percent, 2011: 16.7%
- White persons not Hispanic, percent, 2011: 63.4%
As the meting pot of the world, the makeup of immigrant population in the U.S. has changed over the years. The following three charts show the flow of immigrants into the country based on three factors.
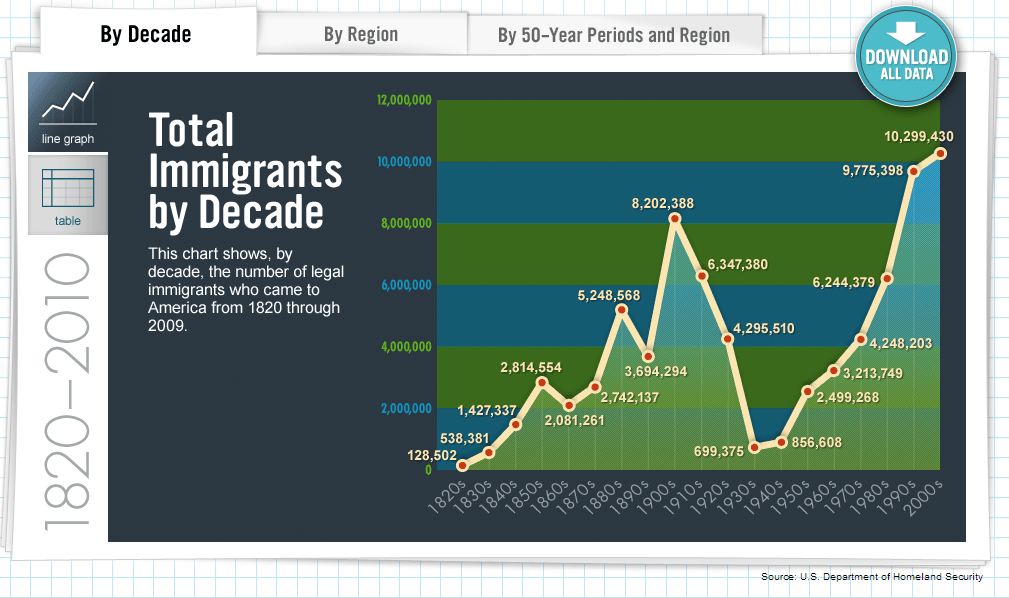
a) Total immigrants into the U.S. by decade:
Click to enlarge
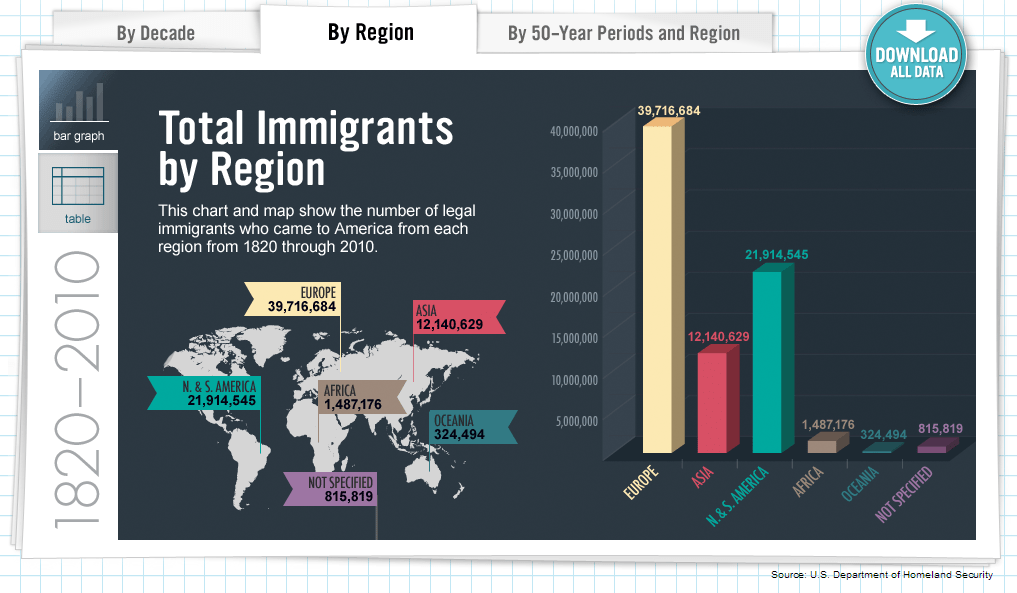
b) Total Immigrants by source region:
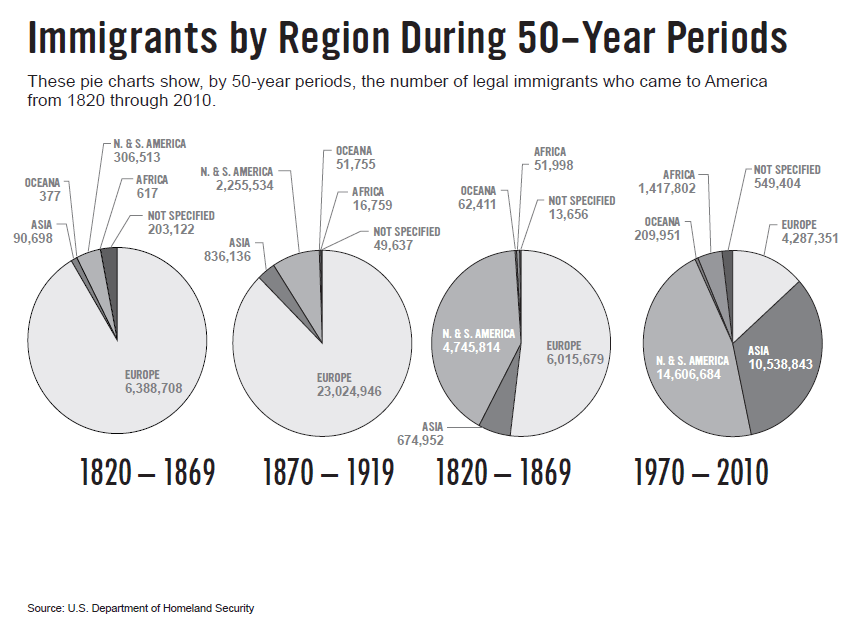
c) Total Immigrants by 50-year periods and region:
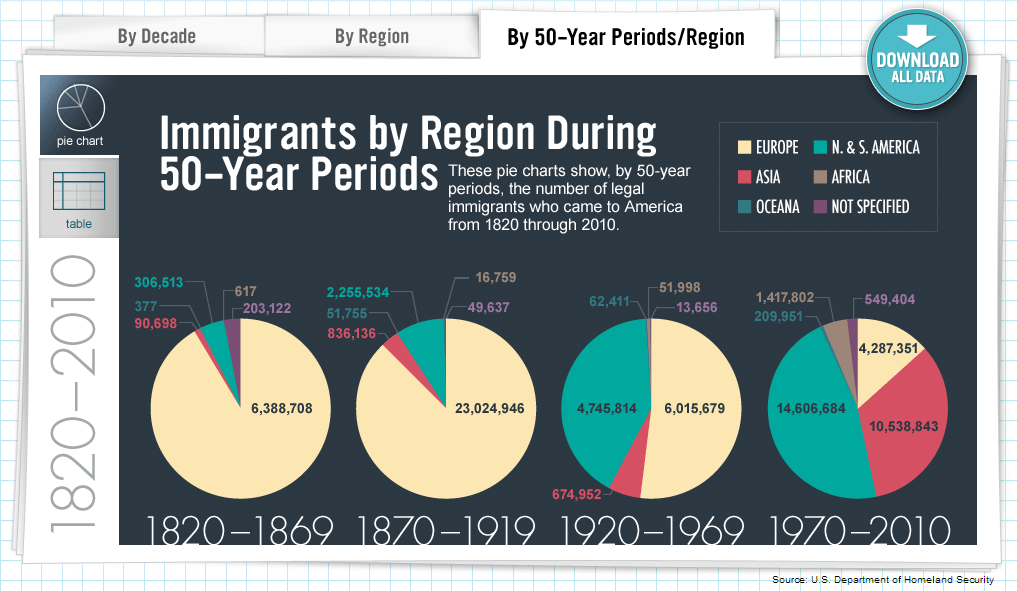
European immigrants were the top immigrants in the 19th century and upto 1919. Even until 1969, Europe contributed most of the legal immigrants to the U.S. However that has changed now with South Americans and Asians being the top immigrants groups.
Source: Immigration, Stories of Yesterday and Today, Scholastic Inc

