Should the Government Cut Federal Workers’ Lavish Compensation?

The U.S. celebrates Labor Day on the first Monday of September(today) while for the rest of the world Labor Day is on May 1st. Labor Day was declared to celebrate the economic and social achievements of workers.

In the U.S. job losses totaled 2.6 million in 2008.Most of the job losses were in the private sector as companies slashed payroll in large numbers to weather the downturn. Since the recession began in December 2007, the economy has lost about 6.9 million jobs. In August the official unemployment rate stood at 9.7%.Millions of workers in the private sector have seen their jobs disappear and are now surviving with the help of unemployment benefits which has been extended many times. Some of the state and local government workers have also been laid off. However their numbers are much lower than the total private sector job losses. One of group of workers who have been shielded from the recession has been the Federal workers. Unlike the state and local governments which depend on taxes and other revenues to pay workers, the Federal government has the exclusive authority to print money. Hence despite the rising deficit that runs in the trillions, the Federal government has been able to keep their employees well paid.For Labor Day 2009 celebrations, the Department of Labor site tag line says “Good Jobs for Everyone”.

Today Federal workers enjoy much higher compensation packages relative to private sector workers. In an article titled”Federal Pay Continues Rapid Ascent” Chris Edwards of the Cato Institute analyzed the compensation levels of Federal workers using data from the The Bureau of Economic Analysis.

The article mentioned:

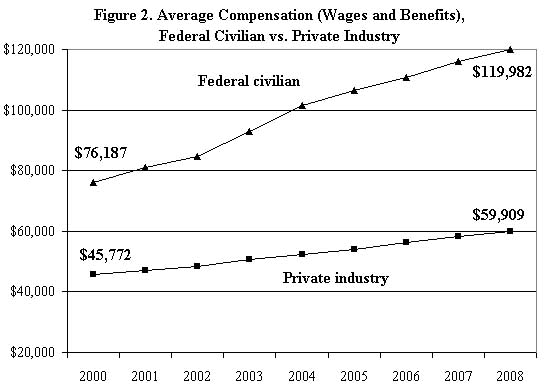
“The George W. Bush years were very lucrative for federal workers. In 2000, the average compensation (wages and benefits) of federal workers was 66 percent higher than the average compensation in the U.S. private sector. The new data show that average federal compensation is now more than double the average in the private sector.

In 2008, federal worker compensation averaged a remarkable $119,982, which was more than double the private sector average of $59,909. ”

Chart
Click to enlarge

Federal-workers-pay

Source: The Cato Institute

The above chart clearly shows that the federal wages are increasing year after year at an astonishing rate when compared to the stagnant to small rises in the private sector. As for the reason behind this great divergence, Chris added:

“Members of Congress who have large numbers of federal workers in their districts relentlessly push for expanding federal worker compensation. Also, the Bush administration had little interest in fiscal restraint, and it usually got rolled by the federal unions. The result has been an increasingly overpaid elite of government workers, who are insulated from the economic reality of recessions and from the tough competitive climate of the private sector.”

In addition to the prestige that goes with working for the Feds, Federal workers also enjoy very high security. In order to pay for such lavish pay and other benefits, the Feds adding more debt each year to the public debt which will be a burden on our future generations.In addition, anyone who has used the services of Federal government knows the excessive fees charged for any kind of services such as passport issuance, security charges when buying airline tickets, etc.

So how many people are employed by the Federal government?. According to the latest available data, there were 2,730,050 in 2007. These employees were paid $14,426,625,181 in December 2007 alone.

The Total Federal Government Civilian Employment 2007 by Function:

[Table=176]

Department of Homeland Security Agencies Total:

[Table=177]

Source: The Census Bureau

For the excellent pay and benefits, in the current economic environment, public sector jobs have become highly attractive to many people looking for work. With health care costs soaring every year and compensation for workers in the private sector not rising to keep up with rising costs, working for the government has become fashionable again.

The importance of the federal benefits was recently underscored by a U.S. Senator. During a townhall in Waukon, Iowa, a constituent asked Sen. Chuck Grassley (R-IA) “Why is your insurance so much cheaper than my insurance and so better than my insurance?”. When Grassley struggled to explain the details of his own health care plan, the man followed up, “Okay, so how come I can’t have the same thing you have?” Grassley replied, “You can. Just go work for the federal government.”

In summary, my answer to the title of this article is Yes, The federal government must cut the lavish benefits and pay of its employees to match the current pay levels in the private sector. Though there may not be a political will to do this, a program to gradually reduce and eliminate some of the liberal benefits offered to federal workers has to be implemented.

The Largest and Most Liquid Australian Stocks

The Dow Jones Australia Titans 30 Index represents the 30 largest and most liquid stocks traded in the Australian market. Stocks are selected based on the rankings by float-adjusted market capitalization and average trading volume.

Australian stocks generally pay high dividends. Hence this index has an yield of 4.61% as of August 31, 2009. After losing about 49% last year, the index is up 50.50% year-to-date as of August 31,2009 in US dollar terms. Financials make up about 55% of the index.

The Top 10 Components and their current dividend yields are listed below:

1.Westpac Banking Corp. (WBK)
Current Dividend Yield = 4.25%

2.Commonwealth Bank of Australia

3.National Australia Bank Ltd. (OTC: NABZY)
Current Dividend Yield = 4.85%

4.BHP Billiton Ltd. (BHP)
Current Dividend Yield = 2.62%

5.Australia & New Zealand Banking Group Ltd. (OTC: ANZBY)
Current Dividend Yield = 4.10%

6.Woolworths Ltd.

7.Westfield Group (OTC: WFGPY)
Current Dividend Yield = 7.37%

8.Wesfarmers Ltd.

9.Rio Tinto Ltd.

10.QBE Insurance Group Ltd.

Russia’s Top 20 Companies

As the world’s largest country in terms of area Russia also has the world’s largest reserves of many natural resources. The country is blessed with an abundant supply of oil, natural gas, gold, diamond and other resources. In fact these resources exceed the reserves of commodity producing countries like Canada and Australia. However the vast majority of Russian resources remain untapped. Since the disintegration of the USSR, some of its vast energy assets have been exploited to meet the growing demands of overseas markets especially Europe. Today Russia is one of the largest producers of oil and natural gas in the world earning the title “energy superpower”.

Since the Russian economy is concentrated heavily towards resources, most of the large Russian companies operate in the energy, mineral mining, metal sectors. The following is a summary of the largest 20 companies in Russia based on rankings by RussiaToday.com. I have listed the ticker if the company trades in any of the US exchanges.

1.Energy Companies
Gazprom (OTC: OGZPY)
Rosneft
TNK-BP
Lukoil (OTC:LUKOY)
Novatek
Gazprom-Neft (OTC:GZPFY)
Surgutneftegas

Gazprom (OTC: OGZPY) is the world’s largest natural gas producer and distributor.Half of the company is owned by the Russian government. Gazprom produces about 85% of Russian gas and exports it to 27 countries mostly in Europe. Year-to-date the ADR is up 36%. In first quarter 2009, Gazprom’s profit fell 62% to 103.7 billion rubles (approx. $3.3B). Gazprom ADR does not pay dividends.

Russia’s largest oil producer is Rosneft. The company is engaged in the exploration, production and marketing of oil and related products. The government owns 75% of Rosneft.TNK-BP is Russia’s 3rd largest oil producer. TNK-BP was formed by the merger of BP’s Russian and Ukrainian operations with those of the Alfa, Access/Renova (AAR) group.

Lukoil (OTC:LUKOY) is a fully privately-owned oil and natural gas producer and marketer. Lukoil pays a dividend of 0.99%. In addition to Russia, it has operations in Azerbaijan, Kazakhstan, Uzbekistan, the Middle East, Colombia, and Northern and Western Africa.

Russia’s second largest natural gas producer is Novatek. Gazprom-Neft (OTC:GZPFY) is a vertically integrated oil company whose major shareholder is Gazprom.YTD the stock is up about 76%.The current yield is 4.82%. Surgutneftegas is another oil exploration and production company.

2. Steel and Metal Companies
Novolipetsk Steel or NLMK
Magnitogorsk Iron and Steel Works or MMK
Evraz
Severstal
Norilsk Nickel (OTC:NILSY)
Polyus Gold (OTC:OPYGY)
Mechel Steel (MTL)
Polymetal

Norilsk Nickel is engaged in the mining of base and precious metals including cobalt, rhodium, silver, gold, iridium and ruthenium. YTD Norilsk ADR has grown by 65%. Polyus Gold is Russia’s largest gold producer with operations mainly in Russia.Polypus Gold currently pays a 0.28% dividend. Mechel is a steel maker and mining company with interests in coking coal, iron ore and nickel.MTR fell below $5 late last year and has now recovered to $12+ range.

3.Other Sector Companies
Wimm-Bill-Dann (WBD) – Russia’s biggest dairy, baby food and beverages company.

Sedmoi Kontinent
Sector: Grocery Retailing

Magnit
Sector: Supermarket operations

X5
Sector: Food Retailing

Lebedyansky
Sector: Fruit Juice and baby food manufacturing

Related item: S&P Russia 10 Index Factsheet

Dow Jones U.S. Economic Stimulus Index: Top 10 Components

The “Dow Jones U.S. Economic Stimulus Index” was first published in May this year to track the performance of the 50 largest U.S. companies that are expected to benefit from the American Recovery and Reinvestment Act of 2009. The act intends to stimulate the economy by investing about $787 B in various sectors such as Alternative Energy, Construction & Materials, Energy Grid, Environment, Technology and
Telecommunications/Internet.

The 50 components of the Dow Jones U.S. Economic Stimulus Index are selected based on market capitalization and are equally weighted. All the companies are related to industries that will be directly impacted by this huge spending.

The S&P was up 12.99% as of August 31,2009. During the same period the DJ Economic Stimulus Index was up 17.01%. About 40% of the components in the index are industrials. Technology stocks make up the second largest group with 18.50%. A brief overview of the Top 10 components of this index follows:

1.Phoenix,AZ based Freeport-McMoRan Copper & Gold Inc (FCX) is one of the world’s largest gold, molybdenum and lowest-cost copper producer. In 2007, the company acquired copper producer Phelps Dodge. As a commodity sector stock, the beta is very high at 1.8. Freeport does not pay regular dividends. Total revenues last year was $13B. The company has operations in Africa, Indonesia, North and South America.

2.McDermott International Inc. (MDR) is an engineering and construction company with a focus on energy, power and oil industries.In the second quarter,2009 the company reported a net income of $92.6 million on revenues of $1,565.0 million. The order backlog was $9.5 B. The current market cap is $5.7 B and the beta is 1.7.

3.Southern Copper Corp. (PCU) is a mining company producing copper, molybdenum, zinc and silver with operations in Mexico,Chile and Peru. Last year the profit was margin was about 17% on revenues of $3.3B. The current dividend yield is 1.42%.

4.Nalco Holding Co.(NLC) is a clean-tech company providing ” integrated water treatment applications to prevent corrosion, contamination and the buildup of harmful deposits”. In the past 52 weeks, NLC is down 23.40% and the current yield is 0.82%. Alternative energy companies such as Nalco and others will be one of the major beneficiaries of the economic stimulus spending in the coming months.

5.The world’s most popular engine company Google Inc’s (GOOG) stock closed at $461.20 on Friday. After its IPO for $100 in 2004, the stock had a meteoric rise crossing $700 in October,2007 creating many paper millionaires called “googlionaires” in the process.As a tech outfit, Google does not pay dividends.The current P/E is 32 and the market cap is $146B.

6.Houston, Texas based KBR Inc.(KBR) engineering and construction company with a significant interest in government sector. Formerly part of Halliburton, KBR has operations in Iraq, Afghanistan and other countries supporting the US government with its civilian and military efforts.Total revenues in 2008 was $12.7B and the annual revenue growth is about 30%. Similar to defense contractors, companies like KBR benefit greatly due to wars and occupations as new infrastructures such as military bases, embassy buildings are built.

7. As one of the largest tech giants in the world, International Business Machines Corp. (IBM) continues to grow in this economic downturn.While the company hasn’t grown in the U.S. in terms of employee count in the past few years, it has grown exponentially in many overseas markets such as India, China, etc. hiring thousands of employees. A while ago IBM even proposed to US employees to move India to keep their jobs and cut costs. IBM’s average profit margin is 13%. The current yield is 1.87%.

8.Intel Corp. (INTC) is one the world’s largest semiconductor chips makers. Intel pays a dividend of 2.85%. Intel used to be one of the favorite tech companies among investors during the dot com era. In the current recession, Intel and other tech companies are growing strongly in overseas markets where the demand for their products is high.

9.Johnson Controls Inc. (JCI) offers “automotive interiors, products and services that optimize energy usage in buildings and batteries for automobiles and hybrid electric vehicles.” The company was founded  in Milwaukee, Wisconsin by Professor Warren S. Johnson who invented the first electric thermostat in 1885. Revenues have been increasing at the rate of about 13% annually in the past 5 years. As more money flows into green technologies in the coming years, Johnson Controls may have higher growth.

10.Cisco Systems Inc.(CSCO) is another tech company that was highly popular among investors in the late 90s. When the dot com boom ended, Cisco fell so hard that for many years investors hoped that they had bought the other Sysco(SYY) instead of Cisco. Cisco is a maker of networking gear such as routers, switches, etc. Cisco is expected to benefit from the spending on upgrade of our broadband infrastructure. In the global broadband household penetration rankings for 2008, the U.S. currently ranks 20th. South Korea took first spot where 95% of households access the internet via broadband.

Banks in Key European Stock Indices

The “top big to fail” concept in the banking industry that has been embraced by U.S. is also true in Europe. European governments also tend to support large banks that are important for the financial system. When smaller banks run into trouble they are left to die or forced to be taken over by bigger rivals. So in one sense, when it comes to investing in European banks , it may be wiser to first pick the large systematically important banks.

One way to identify such large European banks is to review the components of each country’s main stock indices. Following this logic, lets take a look at the banks from the 3 main European stock indices.

1.FTSE 100 Index (UK)
Barclays (BCS)
HSBC Holdings (HBC)
Standard Chartered
Llyods Bank (LYG)
Royal Bank of Scotland (RBS)

2.CAC-40 Index (France)
Credit Agriole
BNP Paribas (BNPQY)
Dexia
Societe Generale (SCGLY)

3.DAX (Germany)
Deutsche Bank (DB)
Commerzbank (CRZBY)

Among the banks listed above HSBC(HBC), BNP Paribas and Deutsche Bank(DB) weathered the credit crisis better than others. With its strong presence in Asia and global reach, HSBC will perform better when the economy improves. Simiarly BNP Paribas(BNPQY) is in a better than position than its rival Societe Generale which was hit with a huge loss last year made by a rogue trade. Risk management at Societe Generale(SCGLY) slipped in the past few years which is unusual. Deutsche bank is the global german banking powerhouse with operations in many emerging countries. Commerzbank(CRZBY), while not as famous as Deutsche Bank, is a large banking group with a rich tradition dating bank to 1800s. It must also be noted that though European banks leveraged themselves much more than US banks during the pre-credit crisis years, they have written off most of the losses and are better positioned now than US banks. This is because they do not have to face huge losses due to collapse in the residential real estate sector as their US peers. Other than UK and Spain, the housing market in most European countries remain stable and unemployment level is still at manageable levels.