Comparision of Government Expenditures: USA vs. Norway

How do the government expenditures of USA and Norway differ?. USA follows the capitalist economic model whereas Norway is a socialist country. It is a general notion that the US spends less on social entitlement programs compared to socialist countries. When we compare the expenditures of Norway and US using the charts below, there is not much difference between these countries especially when it comes to social programs.

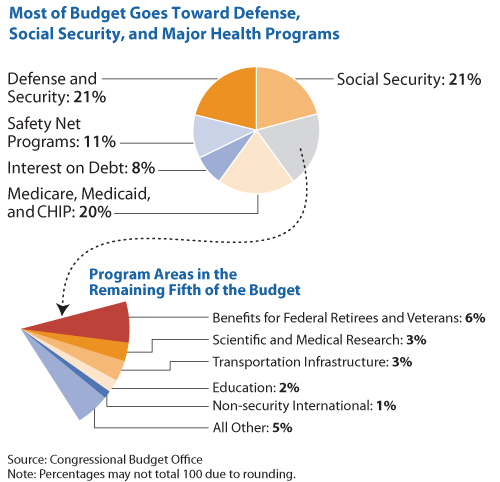
USA – The Federal Budget for 2008

USA-The-Federal-Budget

Norway – Government Expenditures in 2008

Norway-Government-Expenditures

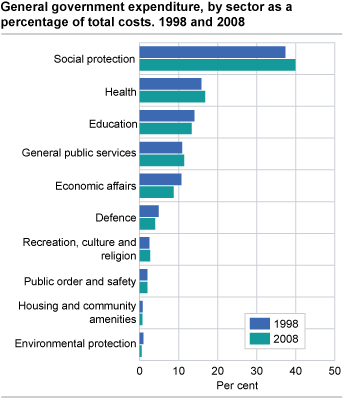
Source: Statistics Norway

The top 3 areas of US expenditures are : Defense and Security, Social security, Medicare and the like. The US spent 21% of the budget on defense and security compared to under 5% by Norway in 2008. This is understandable since the US maintains hundreds of military facilities worldwide and currently runs two wars.

Norway spent about 55% on social benefits and health-care. The total expenses spent on Social Security, Medicare, Medicaid and CHIP and Safety Net Programs equaled 52%. This comparison clearly shows that the US spends more than half of the budget on social programs. Despite being a capitalist country, it shows that the government has become socialistic over the years. Though the “public” option has been eliminated from the health care reform, Uncle Sam is the main provider of health insurance for most of the senior citizens thru Medicaid and Medicare. All these entitlement programs cost the government a lot of money and will continue to grow in the future. Some say that the government run entitlement programs such as the Social Security is the largest ponzi scheme of all as majority of the funds needed for these programs are borrowed from lenders or paid out of tax revenue from workers.

Since Norway is a surplus country it does not have interest payments. As of July this year the US budget deficit amounted to $1.3 Trillion. This US borrows heavily from other countries including the major lenders China and Japan to fund its operations. As a result , 8% of the US budget goes to the payment of interest on national debt. In 2008, the total interest payments were $253 B. As more funds of borrowed to finance additional social welfare programs and the various corporate bailout programs like TARP, this part of the budget will definitely increase. From another perspective, one can say that 8% of the national expenditure went to waste unnecessarily in the form of interest payments.

The remaining 19% of the US budget went to all other areas such as education, transportation infrastructure,scientific research, etc. It would be better if a higher percentage of government spending is allocated for these areas.

How Costly are Financial Crises?

Financial crises are very costly according to an article in the latest edition Finance and Development magazine of the IMF.

Financial crises occur more frequently in emerging countries than developed countries.Between 1972 and 2007 emerging markets have been hit with more currency crises than banking and debt crises. Developed countries have had virtually no debt crisis in the same period.

Costly-crises


The average fiscal cost of banking crises is under 10% of GDP for the developed world compared to more than 15% of GDP for the emerging countries. Output lost is similar to both emerging and developed countries.

On the causes of a financial crisis, the article notes:

“Whereas each differs in its details, nearly all reflect a confluence of some underlying economic vulnerability and a specific crisis trigger. The underlying vulnerability
is often a credit or asset price bubble, a balance sheet mismatch (excessive borrowing in foreign currency, at too-short maturities, or with inadequate capitalization), whereas the crisis trigger can be almost any event—political turmoil, terms of trade shocks, contagion from other countries, or, to take the example of the current crisis, the collapse
of the subprime market (see table)”

The table below shows the vulnerabilities and triggers of some of the past crises:

Crisis-Triggers

On the recent credit crisis that started in the US, the vulnerabilities were the credit and the house price boom. In addition weaknesses in financial regulation resulted in a buildup of leverage and mispricing of risk. The trigger for the crisis was the collapse of the sub-prime mortgage market. Will the financial reforms that are being proposed block astronomical leverages among financial institutions and consequently prevent future crises?.Only time will tell.

Knowledge is Power: The Black Swan Edition

It’s you and me, and everyone else gathered last night at the Grand Hyatt in Hong Kong to receive his lecture on why the financial crisis is far from over.Nassim Nicholas Taleb points to the black swan

So far, Germany’s auto industry has escaped massive job losses, but major cuts could soon be on the cards. The Coming Crisis. How Long Can Germany Keep Auto Jobs?

Consumer prices drop in Japan for the sixth month in a row, at a record rate of 2.4%, due to weak domestic demand.Japan prices continue record fall

To be honest there’s not a lot you can do with it apart from look at it, but that has not prevented generations of investors from coveting gold.The gold rush fuelled by fear

Three Nasdaq-listed Argentina ADRs

Argentina is the second largest country in South America after Brazil. It is classified as a
upper-middle income market by the World Bank. Like Brazil, Argentina is blessed with an abundance of natural resources. Agriculture is one of the main export sectors.

Argentina had been plagued with financial crisis for many years. From the Wikipedia: “By 2002, Argentina had defaulted on its debt, its GDP had shrunk, unemployment reached 25% and the peso had depreciated 70% after being devalued and floated”. However after 2003 the economy started to improve after the implementation of effective expansionary policies.

Three Argentina companies trade on the NASDAQ market. The following is a brief summary on these ADR stocks:

1. Cresud (CRESY) is an agricultural company with interests in crop production, beef cattle raising and milk production. In addition the company involved in the real estate business. Cresud owns 19 farms. As a commodity sector stock, it has a high beta of 1.6. The 5-year average annual earnings growth is 57% and the P/E ratio is 21.43. YTD Cresud is up 42%. Since agricultural products is one of the top exports of Argentina, Cresud is an attractive stock at lower levels.

2. Alto Palermo (APSA) is a real estate company engaged in the leasing, ownership and operation of shopping centers. It operates 11 shopping malls in Argentina. The current yield is 15.5% and the beta is 1.3. The stock ha grown by 27% YTD.

3.Grupo Financiero Galicia S.A. (GGAL) is a financial services holding company engaged in offering banking, financial and investment services. GGAL closed at $4.5 yesterday and it pays no regular dividends.

Tier 1 Capital Ratios and NPAs of Unofficial Problem Banks in the U.S.

We reviewed the Tier 1 Capital Ratios of large U.S. banks back in June. In this post, lets take a look at the Tier 1 Capital Ratios and Non-Performing Assets (NPAs) of some of the banks from the Unofficial Problem Banks list created by Calculated Risk. CR compiled this list from various press releases from the FDIC, OCC, Fed and OTC. In the table below, I have included banks that trade in the organized exchanges only. Banks that are in the process of merger are excluded.

The latest Tier 1 Capital Ratio and Non-Performing Assets (NPA) Ratio of Unofficial Problem Banks in the US are shown:

[TABLE=180]

Note: NA denotes “Not Applicable” if these ratios are not readily available. Data is known to be accurate at the time this article was written. Please do your own research before making any investment decisions.

Large US banks have Tier 1 Capital Ratios in excess of 10%. In the above list most of the banks have low Tier 1 ratio of under 10% which suggests they are weak and prone to fail. Most of the banks in the list are small banks with market capitalization of just a few millions. The stock prices of most these banks are are in the low single digits or even under a dollar.

Spokane,Washington-based AmericanWest Bank (AWBC) has the lowest Tier 1 Capital ratio at 3.3%. The bank has a market cap of just $9M at its current stock price of $0.54. Last week the the Fed ordered it to halt dividend payments and to submit a plan to improve its capital base. Banks that have Tier 1 capital ratios under 5% are First Mariner Bancorp (FMAR),First National Bancshares Inc (FNSC) and Horizon Financial Corp. (HRZB).

Banks with more than 10% Tier 1 ratio include ADVANTA Corp (ADVNA), Camco Financial Corporation (CAFI), Cadence Financial Corp (CACB), Capitol Bancorp Ltd.(CBC), City Bank (CTBK), Royal Bancshares of Pennsylvania Inc. (RBPAA) and United Community Financial Corp(UCFC).

City Bank (CTBK) has a nonperforming assets to total asset ratio of an incredible 47.38%. This is because City Bank was a lender focused on residential construction. Advanta Corp (ADVNA) which issues credit cards to small businesses and business professionals has been slapped with a notice by NASDAQ for failing to meet continued listing requirements. Current stock price is $0.59. With many small businesses going bankrupt and credit card charge defaults soaring, it is not surprising to see Advanta struggling to survive.

Due to their weak position many of the above 35 small banks will fail or be forced to merge with strong banks unless they raise additional capital and rid their balance of toxic assets. Unlike the “too big to fail” large banks, Uncle Sam will not bail out these small community banks.