The 3 ETFs that investors can use to invest in foreign utilities are iShares S&P Global Utilities Sector Index Fund (JXI) , WisdomTree International Utilities Fund(DBU) and SPDR S&P International Utilities Sector Fund (IPU).
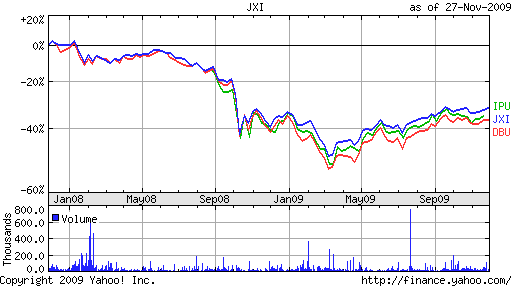
Among these ETFs, iShares’ JXI is the largest fund with an asset base of $165M. The distribution yield is 5.62%. In addition to foreign utilities, JXI invests in US utilities also such as Exelon (EXC) and Southern Company (SO). As of 10/31/2009 this year, the fund has a negative return of 2.19%. Last year it was down 29.15%. However the fund is an easy way to gain exposure to many foreign utilities like Iberdrola (Spain), Centrica(UK) and E.ON(Germany).
Comparison of 3 ETFs for Global Utilities:
[TABLE=248]
2-Year Performance Comparison:
Among its top 10 holdings, WisdomTree International Utilities Sector Fund has some excellent utility stocks including Fortum Oyj of Finland and Electricite de France of France. The SPDR S&P International Utilities Sector Fund (IPU) has a very low asset base of just $4M.