The Top 10 Components of the Dow Jones BRIC Brazil 15 Index

The Dow Jones BRIC Brazil 15 Index represents 15 of the largest and most liquid stocks traded on the Bovespa stock exchange of Brazil.

In US $ terms, the index had an exceptional performance this year. As of November 30th, the index is up nearly 136%. In terms of the Brazilian Real it is up about 77%. Last year this index lost 56%.

The Top 10 Components of the Dow Jones BRIC Brazil 15 Index:

  1. Petroleo Brasileiro (PBR)
  2. Vale S.A. (VALE)
  3. Itau Unibanco Holding S.A. (ITUB)
  4. Banco Bradesco S/A (BBD)
  5. OGX Petroleo e Gas Participacoes S/A
  6. Itausa-Investimentos Itau S/A
  7. Banco do Brasil S/A (OTC: BDORY)
  8. Companhia de Bebidas das Americas  (ABV)
  9. Companhia Siderurgica Nacional (SID)
  10. BM&F Bovespa S/A Bolsa de
  11. Valores Mercadorias e Futu

Banco do Brasil (OTC: BDORY) is controlled by the federal government. It is the oldest bank in Brazil and was founded in 1808. The DR program was started this month. Each ADR represents one common share and trades on the OTC market. Others such as PBR, VALE, BBD, ITUB are some of the hot Brazilian stocks preferred by investors worldwide.
Ten Components of the Dow Jones BRIC India 15 Index

The Dow Jones BRIC India 15 Index tracks the performance of the 15  most liquid and largest stocks traded on the Indian exchanges.

As of November 30,2009 the index has a total return of 77% in US dollar terms. The dividend yield of the index is 0.95% and the annual rebalancing occurs in June.

The Top 10 Components of the Dow Jones BRIC India 15 Index:

  • Reliance Industries Ltd.
  • Infosys Technologies Ltd. (INFY)
  • Housing Development Finance Corp. Ltd. (HDB)
  • ICICI Bank Ltd. (IBN)
  • State Bank of India
  • Larsen & Toubro Ltd.
  • Jindal Steel & Power Ltd.
  • Oil & Natural Gas Corp. Ltd.
  • ITC Ltd.
  • Bharti Airtel Ltd.

A Lost Decade for U.S. Stocks

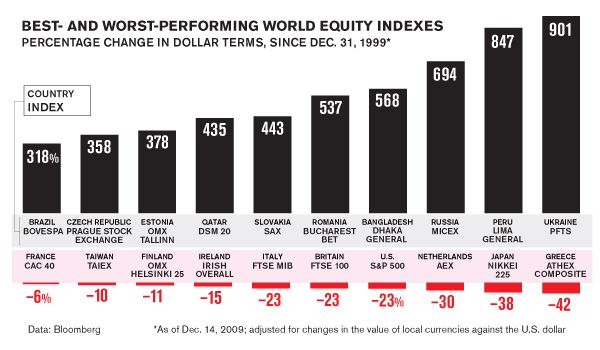
I came across two charts that show the dismal performance of U.S. equities in this decade. The first chart below is from the Numbers column in the latest issue of Bloomberg Businessweek. It shows the return of U.S. S&P 500 Index from Dec 31, 2009 thru Dec 14, 2009. The S&P 500 lost 23% in this period. During the same period market indices in developed countries like France, Finland, etc.  showed relatively better performance. The main stock market indices in the Netherlands, Japan and Greece performed worse than the S&P 500.

It is interesting to note that while the S&P lost 23%, the Brazilian Boverspa Index gained  an astonishing 318% during the same time.This is one reason why US investors should look beyond the US for better returns.

Stock-Markets-Soared-Sank

Source: Bloomberg BusinessWeek

The second chart is from a Wall Street Journal December 20th article titled “Investors Hope the ’10s Beat the ’00“. From the article:

“The U.S. stock market is wrapping up what is likely to be its worst decade ever.

In nearly 200 years of recorded stock-market history, no calendar decade has seen such a dismal performance as the 2000s.

Investors would have been better off investing in pretty much anything else, from bonds to gold or even just stuffing money under a mattress. Since the end of 1999, stocks traded on the New York Stock Exchange have lost an average of 0.5% a year thanks to the twin bear markets this decade.

The period has provided a lesson for ordinary Americans who used stocks as their primary way of saving for retirement.

Many investors were lured to the stock market by the bull market that began in the early 1980s and gained force through the 1990s. But coming out of the 1990s—when a 17.6% average annual gain made it the second-best decade in history behind the 1950s—stocks simply had gotten too expensive. Companies also pared dividends, cutting into investor returns. And in a time of financial panic like 2008, stocks were a terrible place to invest.

With two weeks to go in 2009, the declines since the end of 1999 make the last 10 years the worst calendar decade for stocks going back to the 1820s, when reliable stock market records begin, according to data compiled by Yale University finance professor William Goetzmann. He estimates it would take a 3.6% rise between now and year end for the decade to come in better than the 0.2% decline suffered by stocks during the Depression years of the 1930s.

The past decade also well underperformed other decades with major financial panics, such as in 1907 and 1893.

“The last 10 years have been a nightmare, really poor,” for U.S. stocks, said Michele Gambera, chief economist at Ibbotson Associates.”

Chart – U.S. Stocks’ Cumulative Returns by Decade

“This decade is on pace to be the worst period ever for owning stocks. On the right are the annual returns, by year and decade, for a broad measure of stock-ownership. Stock returns were even better during the Civil War and World War I than from 2000 to 2009.”

Worst-Decade-Stocks

Source: WSJ

Ten Components of the DJ Emerging Markets Oil & Gas Titans Index

Among the 10 most profitable companies in the world based on 2008 data, energy companies occupy the top six spots. Two of the companies in that list (GazProm and PetroChina) are from emerging markets with the rest being the usual Western energy giants. The emergence of two companies from Russia and China in the top 10 list shows the growing power of the emerging market oil companies in the global energy industry.

The Dow Jones Emerging Markets Oil & Gas Titans 30 Index aims to “represent 30 of the largest emerging-market companies in the Oil & Gas Industry as defined by the Industry Classification Benchmark(ICB). Stocks are selected to the index based on rankings by float-adjusted market capitalization, revenue and net profit”. As emerging markets have soared this year, so has this index. The total return for this index as of November 30th, 2009 is 76.88%.

The Top 10 Components of the Dow Jones Emerging Markets Oil & Gas Titans 30 Index are listed below:

Petroleo Brasileiro (PBR)
Brazil

Surgutneftegaz JSC ADS (OTC:SGTZY)
Russia

Reliance Industries Ltd.
India

Gazprom OAO ADS (OTC: OGZPY)
Russia

PetroChina Co. Ltd. (PTR)
China

Lukoil Holdings ADS (OTC: LUKOY)
Russia

Sasol Ltd. (SSL)
South Africa

China Petroleum & Chemical Corp. (SNP)
China

Rosneft GDR (OTC: RNGZY)
Russia

Oil & Natural Gas Corp. Ltd.
India

Some of the oil and gas companies listed above are state-owned companies and are growing both domestically and internationally by acquisitions.