Stock market predictions: What next for shares?
Olive: Big Five banks hold themselves back
Rogers, Faber Advise Paring Investments as U.S. Stocks SlumpÂ
Energy – Coal light of day

London,UK
The S&P 400 MidCap Index measures the performance of U.S. mid-size companies with market caps from about $2billion to $10 billion. The stocks in this index are selected based on market cap, liquidity and industry representation.
In terms of performance the index is up 7.3% YTD. The annualized 5-year return is 5.4%. The average market cap of the constituents is $2.39B and the market cap of the largest constituent is $7.40B. Similar to the S&P 600,the top five sectors represented in this index are: information technology, consumer discretionary, consumer staples, health care and industrials.
The following S&P MidCap 400 Constituents pay over 4% dividends as of May 6, 2010:
[TABLE=492]
Some of the ETFs that track the S&P 400 include the iShares S&P SmallCap 400 Index ETF(IJH) and the SPDR S&P MidCap 400 ETF(MDY).
Note: Information posted above is known to be accurate. Please do your own reasearch before making any investment decisions.
The S&P SmallCap 600 Index covers approximately 3% of the domestic equities market.The constituents of this index are selected based on market capitalization and other criteria to ensure they are investable and financially viable. Since the small cap universe is made of up of stocks that are known for poor trading liquidity and financial instability, the SP 600 components are much better than others.
In terms of performance, the S&P 600 is up 8.9% YTD. The average constituent market cap is $0.73 B.Consumer discretionary, consumer staples, information technology, health care and industrials form the top five sectors in this index.
The following S&P Small 600 stocks pay more than 5% dividend as of May 6, 2010:
[TABLE=491]
For investors that prefer an ETF for investing in small caps, the iShares S&P SmallCap 600 Index (IJR) is one option.
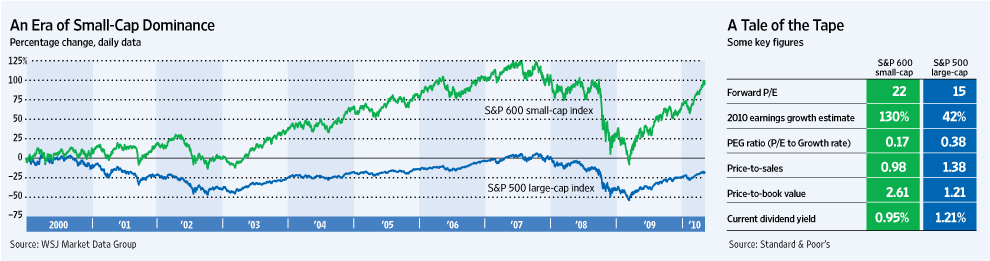
In my December 2009 article A Lost Decade for U.S. Stocks, I mentioned that the S&P 500 lost 23% from Dec 31, 1999 through Dec. 14, 2009.
A recent article in the Journal titled “Small Caps Loom Large” notes that the small cap stocks in the U.S. have rallied strongly since the decade that began Jan 1, 2000 when large caps have lost ground.
Some key points from the article:
Chart – Small Caps vs. Large Caps :
Click to Enlarge
U.S. Small Cap ETFs:
iShares S&P SmallCap 600 Index Fund (IJR)
iShares Russell 2000 Index Fund (IWM)
iShares Morningstar Small Core Index Fund (JKJ)
SPDR DJ Wilshire Small Cap ETF (DSC)
Vanguard Small-Cap ETF (VB)
Schwab U.S. Small-Cap ETF (SCHA)
International Small-Cap ETFs:
iShares MSCI EAFE Small-Cap Index Fund (SCZ)
International Small-Cap Fund (GWX)
FTSE Developed Ex-US Small Cap ETF (IFSM)
Vanguard FTSE All-World ex-U.S. Small Cap ETF (VSS)
SPDR S&P Emerging Markets Small Cap (EWX)
Source: Seeking Alpha, ETF Trends
As individual small cap stocks can be very volatile and may have low daily trading volumes, it is easier and wise to invest in them with ETFs.
 Central banks have blown yet another bubble – here’s how to protect yourself
The dividend strategies that best juice returns
China’s Cut-Throat Railway Revolution
Who’s Got Those Pitchforks?
Russian Telecommunications Prepared to Fly as Data SoarsÂ
Chinese stocks: Canary in the coalmine?
Pimco’s Bill Gross slams rating agencies’ ‘lack of commonsense’