The Periodic Table of Commodities Returns 2024: Chart

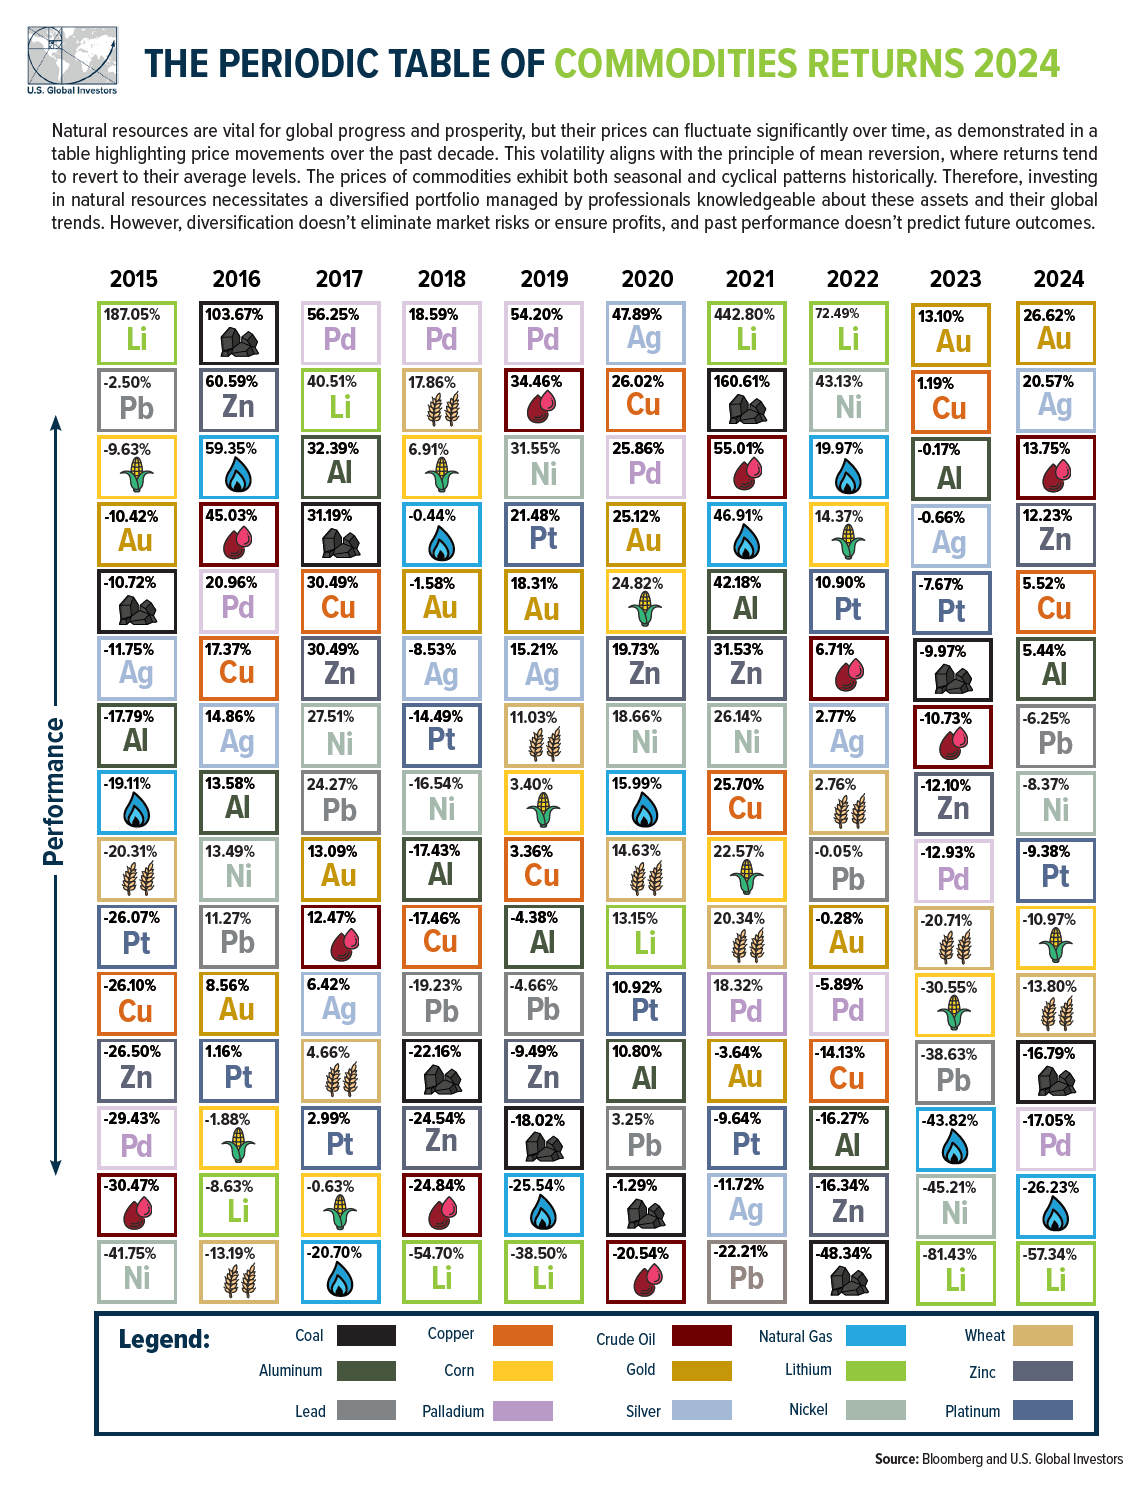
The Periodic Table of Commodities Returns chart for 2024 was published by U.S. Global Investors recently. This handy one-pager provides an overview of the returns of various commodities over the year. In 2024, the best performing commodity was Gold with a return of over 26%. This is the second year in a row that the yellow metal has had the best return. The worst performer was Lithium with a decline of 57%, again for a the second consecutive year. Crude oil had a decent with a gain of about 14%.

Gold is soaring again this year. It will be interesting to observe if it ends the year with the best return. From looking at the chart below, Lithium had the top return in 2021 and 2022 as the demand for EVs soared during that time. The return of over 442% in 2021 was indeed amazing. This also coincided with the peak returns for many of the auto-supplier stocks and not just Lithium and EV-related stocks.

Click to enlarge
Source: U.S. Global Investors

For an interactive version of the above chart, click on the link above.

Related ETFs, Stocks and ETNs:

  • United States Oil Fund LP (USO)
  • Albemarle Corporation (ALB)
  • Sociedad Quimica y Minera de Chile (SQM)
  • SPDR Gold Trust (GLD)

Disclosure: No positions
Developed Market Annual Total Returns from 2010 to 2024: Chart

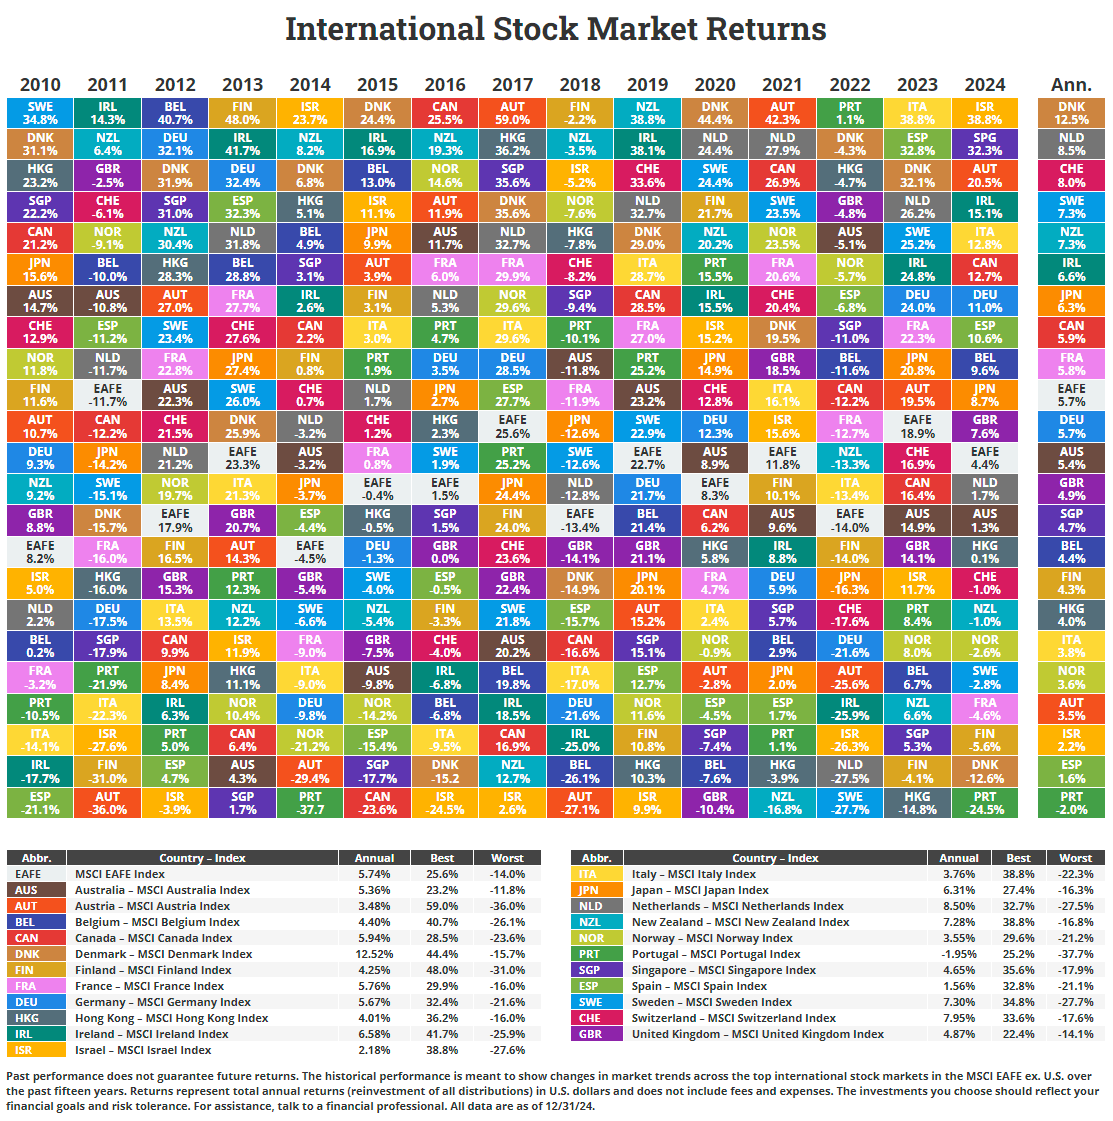
Novel Investor recently published their annual returns chart for the developed markets from 2010 to 2024. Last year the top performing market among the developed markets was Israel with a 38% total return followed by Singapore and Austria. A year-end surge in banking giant DBS Group Holdings (DBSDY) helped the Singapore equity market with strong returns. The German market had decent returns as well with a gain of 11%.

Click to enlarge

Note: All returns shown above are total returns in US dollars (including dividends reinvested) and are based on MSCI country index returns.

Source: Novel Investor

Related ETFs:

  • iShares MSCI Germany Index Fund (EWG)
  • iShares MSCI Canada Index Fund (EWC)
  • iShares MSCI Australia Index Fund (EWA)
  • iShares MSCI United Kingdom Index (EWU)
  • iShares MSCI Singapore Index (EWS)

Disclosure: No positions

Latin American Immigration to Canada: Infographic

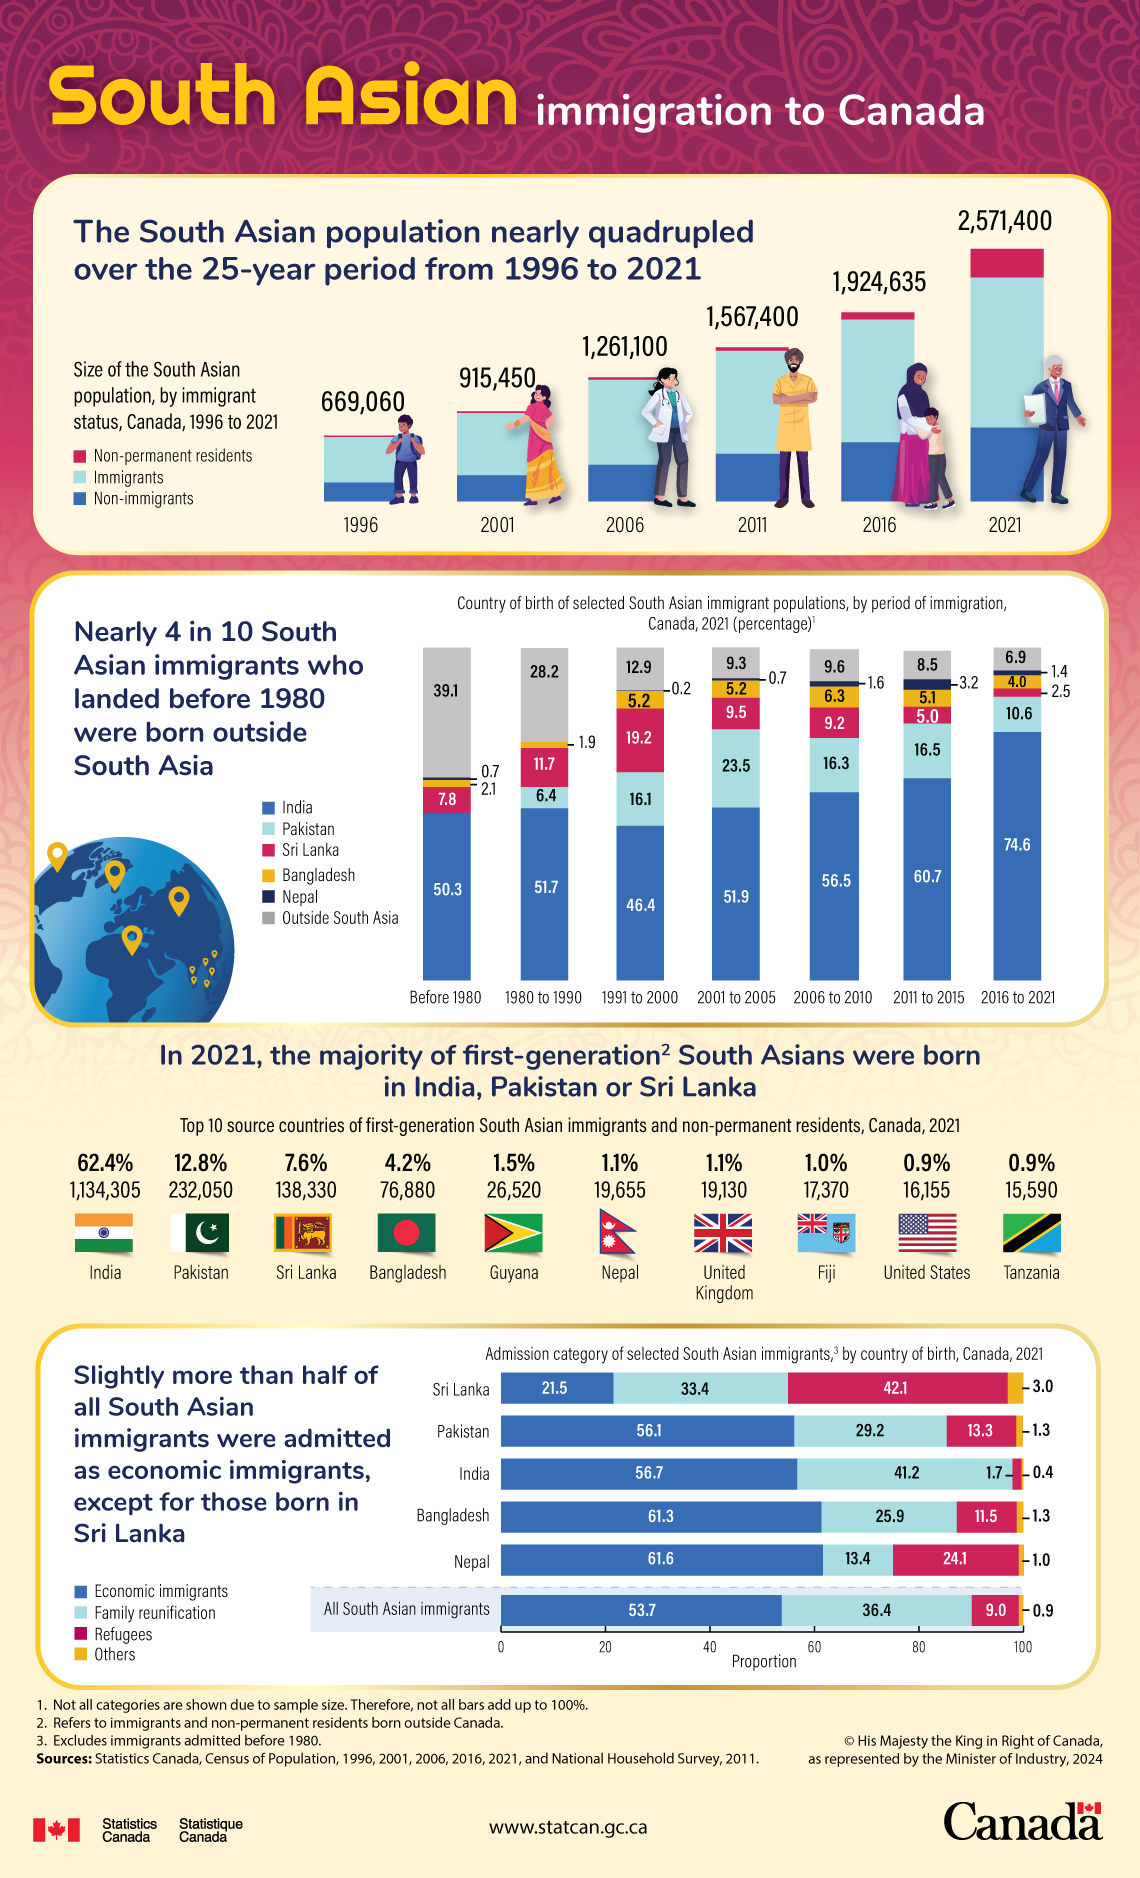
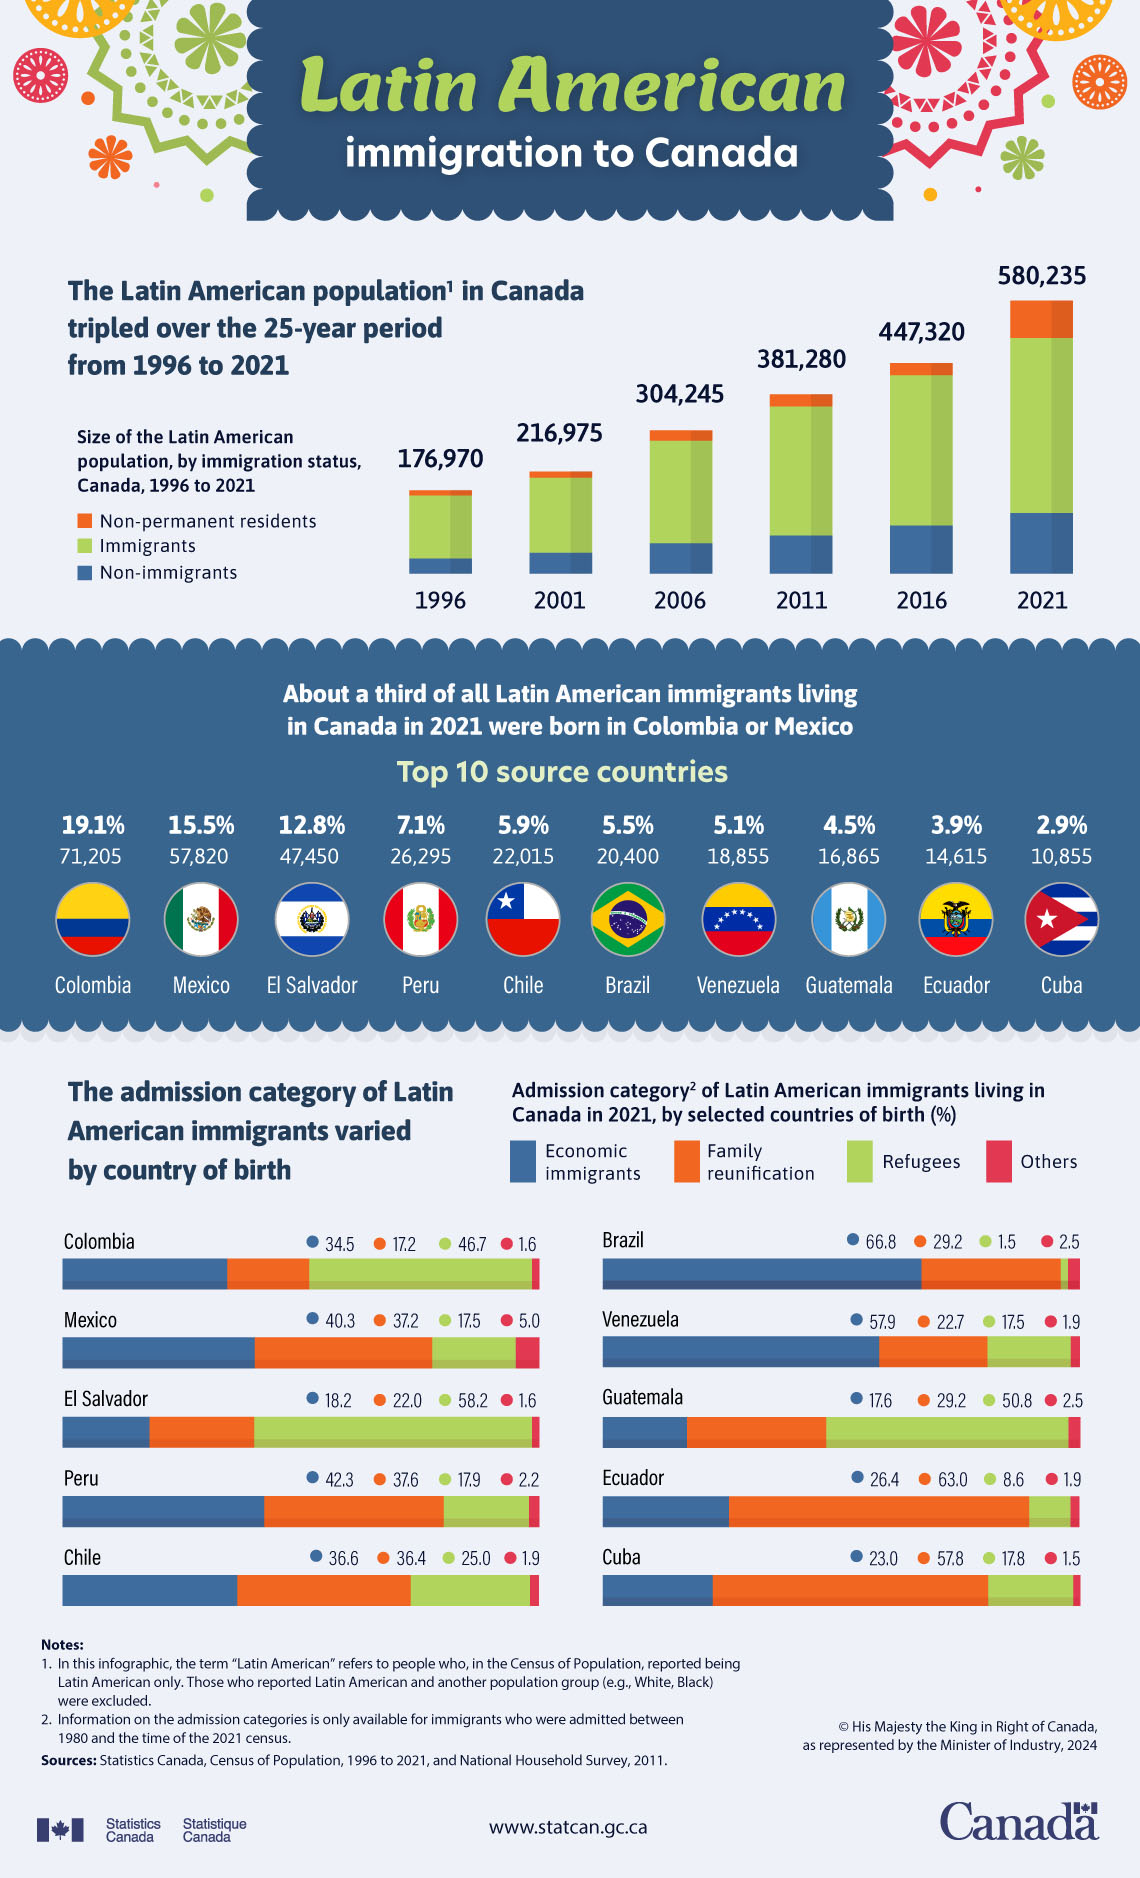
The Latin American population in Canada tripled in the years from 1996 to 2021. However Latin American immigration to the country is much lower when compared to South Asian immigration. During the same 25-year period, South Asian immigration nearly quadrupled and the total population of South Asians stood at over 2.5 million.

Click to enlarge

Source: Statistics Canada