20 High-Yielding European Utility Stocks

A recent “Heard on the Street” column in The Wall Street Journal discussed about the juicy dividends offered by European stocks.

From the article:

“Average dividend yields on European stocks are now higher than those on government bonds for only the third time in 30 years. On the past two occasions, in early 2003 and 2009, that heralded a rally in equities. But although equity markets are below long-term price-to-book ratios, and European stocks have rallied in recent weeks, analysts are cautious about forecasting big gains, noting an uncertain growth outlook and lingering fears on sovereign debt. That is good news for income investors.

This year, European equities will yield 4.1%, estimates UBS, almost twice that of U.S. peers. That is above the current yield on AA-rated corporate bonds (3.3%) and the coupon on a 10-year government bond for a weighted average of 11 euro-zone countries (3.6%). Unlike the latter two, dividend yields are well above their 10-year average.

True, dividends can be cut. Payments have been cut some 40% since 2008, versus cuts of less than 30% in the past three recessions. The cancellation of BP’s dividend in June took 12% off forecasts for U.K. companies’ second-quarter payments, notes Capita Registrars. Corporate earnings could still disappoint: UBS forecasts of 24% European earnings growth in 2010 and 10% in 2011 compare with a 7% long-run average, and a contraction last year and in 2008.

But corporate cash balances are at or near all-time highs and gearing at multiyear lows. Companies are slowly returning to the acquisition trail: July’s M&A deal volume globally was the highest this year, notes Dealogic, with Europe leading the way. But dividend payments still look sustainable: Dividend cover at 1.6 times free cash-flow is in line with a 10-year average, notes UBS.”

European banks have traditionally paid high dividends in the past. However it is better to avoid the majority of them as they are still reeling under pressure from many issues related to the sub-prime crisis.  Quoting JP Morgan, the journal piece noted that telecoms, energy and utilities offer 5% to 6% yields.

In order to identify the top utilities in Europe, I used the Dow Jones Stoxx Europe 600 Utilities Index.This index offers exposure to 31 of the large European water, gas and electricity companies.

The Top 20 components in the Dow Jones Stoxx Europe 600 Utilities Index are listed below with their dividend yield as of August 9, 2010:

1.E.ON AG (OTC: EONGY)
Current Dividend Yield: 6.18%
Germany

2.GDF Suez (OTC: GDFZY)
Current Dividend Yield: 4.68%
France

3. Enel (E)
Current Dividend Yield: 5.61%
Italy

4.RWE AG (OTC: RWEOY)
Current Dividend Yield: 6.33%
Germany

5.Iberdrola (OTC: IBDRY)
Current Dividend Yield: 5.51%
Spain

6. National Grid Plc (NGG)
Current Dividend Yield: 8.34%
UK

7. Scottish & Southern Energy (OTC: SSEZY)
Current Dividend Yield: 3.44%
UK

8.EDF (OTC: ECIFF)
Current Dividend Yield: 3.09%
France

9. Centrica (OTC: CPYYY)
Current Dividend Yield: 5.32%
UK

10. Fortum (OTC: FOJCY)
Current Dividend Yield: 5.48%
Finland

11. Veolia Environnement (VE)
Current Dividend Yield: 5.18%
France

12. International Power (OTC:IPRPY)
Current Dividend Yield: 4.10% *
UK

* Update: International Power owners set for £1.4bn payout

13.Energias de Portugal (OTC: EDPFY)
Current Dividend Yield: 5.83%
Portugal

14. SNAM Rete Gas SpA (OTC: SNMRY)
Current Dividend Yield: 4.87%

15.United Utilities (OTC: UUGRY)
Current Dividend Yield: 7.67%
UK

16. Terna
Italy

17. Suez Environment (OTC: SZEVY)
Current Dividend Yield: 4.17%
France

18.  Severn Trent (OTC: SVTRY)
Current Dividend Yield: 3.28%
UK

19. Red Electrica Espana (OTC: RDEIY)
Current Dividend Yield: 5.40%
Spain

20. Gas Natural SDG (OTC: GASNY)
Current Dividend Yield: 7.79%
Spain
Which is a Better Invesment – Germany or U.K.?

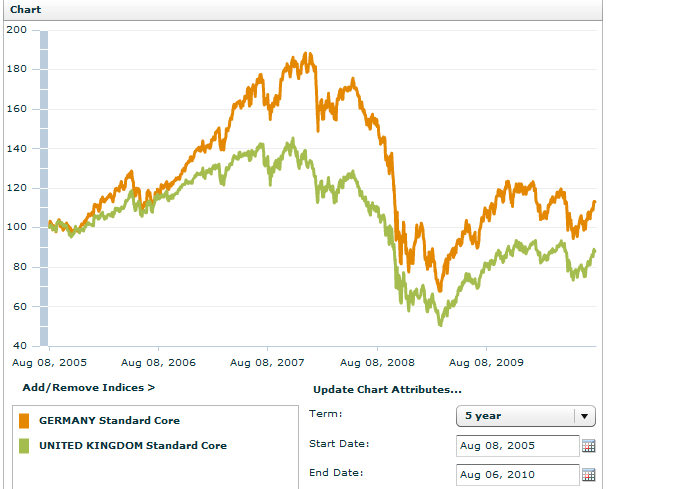
The U.K. and Germany are two of the largest economies in Europe. In terms of investment returns, Germany is well ahead of the UK in the past five years as shown in the chart below:

MSCI-Germany-vs-UK-Returns

Source: MSCI Barra

The chart compares the performance of MSCI country index for Germany and the UK in dollar terms. British equities fell more than German equities during the financial crisis. Over the past five years, German stocks have performed better than British stocks. The 1-year and 5-year annual average returns are 4.25% and 5.28% for Germany compared to 7.69% and -2.28% for UK.

The iShares MSCI Germany Index Fund (EWG) tracks the  MSCI Germany Index.The fund has an asset base of $1.5B and financials account for 18% of the portfolio.Year-to-date the ETF is down 1.78%

The iShares MSCI United Kingdom Index Fund (EWU) tracks the  MSCI index for UK.The fund has an asset base of about $984M and financials account for 21% of the portfolio.The fund allocation for industrials is 5% compared to 15% in EWG. Year-to-date the fund is up 0.63%.

Three European Auto Stocks

European car companies continue to increase production compared to last year as demands picks up in the domestic and overseas markets. Car makers in European have traditionally built smaller, fuel-efficient cars that are demanded by European consumers. In addition, these companies also reproduce the same strategy when selling in the fast-growing emerging markets such as Brazil, China, India, etc. the demand for small cars is high.

From a July ACEA report:

“New passenger car production in the EU recorded a rebound of 34% three months into the year, compared to the first quarter of 2009. However, production was still 13% down when compared to the first quarter of 2008. The same picture emerged in the segment of vans. Despite a 51% increase three months into the year 2010, production of vans remained 35% below the pre-crisis level of 2008. Truck production decreased by 5% until April this year, and by 63% compared to the first quarter of 2008. The segment of buses declined by 22% three months into the year compared to the same period in 2009.

In units produced, Germany remained the largest auto manufacturing country in the EU (1.4 million units, +33%), while the UK saw its car production pick up most (+72.7%) compared to the first quarter of the previous year. Except for Finland (-59.5%), Belgium (-10.5%), the Netherlands (-7.5%) and Italy (-0.1%), all countries posted growth.”

There are a handful of European car makers that are listed in the US markets.The majority of them are traded on the OTC market. Three of these auto stocks are:

  1. Peugeot Citroen (PEUGY) of France
  2. Fiat (FIATY) of Italy and
  3. Volkswagen (VLKAY) of Germany

Wolfsburg,Germany-based Volkwagen Groups owns the Volkwagen, Skoda, Audi, Seat, Bugatti, Lamborghini, Volkswagen Commercial Vehicles, Bentley and Scania brands. In 2009, the group held 11.3% of the global passenger car market. The company employees 370,000 workers around the world.

The Fiat group is the largest industrial firm in Italy. Europe accounts for just about 35% of total revenues. The company’s stock is listed on the Milan, Paris and Frankfurt exchanges and in the U.S. market thru an ADR program. Some of the car brands owned by Fiat are Fiat, Alfa Romeo, Lancia, Ferrari, Maserati and Abarth.

France-based PSA Peugeot Citroën has gained worldwide reputation for producing environmentally friendly vehicles. The company is heavily expanding in China, Latin America and Russia. Last year the auto maker sold 3,188,000 units worldwide under the Peugeot and Citroën brands.

Knowledge is Power: Dow 1,000?, Poland, Canada Housing Edition

Marc Faber Questions if Dow Could Hit 1,000

Getting real: Bull run coming to an end for Canada’s housing

Can the US raise employment with more exports?

The Politically Incorrect Guide to Ending Poverty

Five retail stocks that can beat consumers’ blues

Slave-like conditions await Asian interns

Billionaire blow off

Pole Position Poland is laying the foundation for a sustainable long-term recovery.

EU bank stress test fails to reassure

War memorial Kuala Lumpur

War Memorial, Kuala Lumpur, Malaysia

10 Canadian Dividend Stocks

The Dow Jones Canada Select Dividend Index represents the leading Canadian stocks by dividend yield. The index contains 30 stocks which are selected annually based on dividend yield.

The divided yield of this index is 4.37% as of July 30th. The annualized total return of the index is 10.65% in Canadian dollar terms. Financials account for about 61% of the total allocation.

The  Top 10 components of the Dow Jones Canada Select Dividend Index are:

1.Canadian Imperial Bank of Commerce(CM)
Current Dividend Yield: 4.82%

2.Bank of Montreal (BMO)
Current Dividend Yield: 4.43%

3.Toronto-Dominion Bank (TD)
Current Dividend Yield: 3.20%

4.National Bank of Canada (OTC: NTIOF)
Current Dividend Yield: 4.11%

5.Telus Corp (TU)
Current Dividend Yield: 4.92%

6.Bank of Novo Scotia (BNS)
Current Dividend Yield: 3.70%

7.Manitoba Telecom Services Inc (OTC: MOBAF)
Current Dividend Yield: 9.84% *

* Note: Manitoba cut its dividends by a third on August 6th and also lowered the outlook

8.Royal Bank of Canada (RY)
Current Dividend Yield: 3.72%

9.IGM Financial Inc(OTC: IGIFF)
Current Dividend Yield: 4.97%

10.Canadian Utilities Ltd(OTC: CDUAF)
Current Dividend Yield: 3.46%

Montreal-based National Bank of Canada is the 6th largest bank in Canada. The bank operates most of its branches in the French-speaking province of Quebec.