Infographic: Who Spends the Most at McDonald’s?

I came across this interesting graphic about U.S. fast-food giant McDonald’s:

Click to enlarge
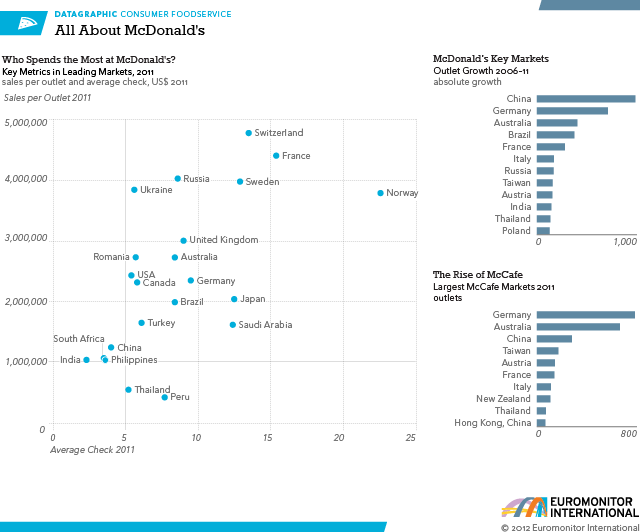
 

Source: McDonald’s: Dominant the World Over, Yet No Two Markets Alike,  EuroMonitor International

Related ETFs:

SPDR Consumer Discretionary ETF (XLY)

SPDR Dow Jones Industrial Average (DIA)

Vanguard Dividend Appreciation ETF (VIG)

Disclosure: No Positions
Comparing the Performance of Major North American Railroads

Six of the major railroad companies that operate in North America currently are publicly-listed. These Class I freight railroads are:

1.Company: Canadian National Railway Co (CNI)
Current Dividend Yield: 1.68%
Country: Canada

2.Company: Canadian Pacific Railway Ltd (CP)
Current Dividend Yield:
Country: Canada

3.Company: CSX Corp (CSX)
Current Dividend Yield: 2.78%
Country: USA

4.Company: Kansas City Southern (KSU)
Current Dividend Yield: 1.02%
Country: USA

5.Company: Norfolk Southern Corp (NSC)
Current Dividend Yield: 3.32%
Country: USA

6.Company: Union Pacific Corp (UNP)
Current Dividend Yield: 2.26%
Country: USA

Note: Dividend yields are as of Dec 5, 2012

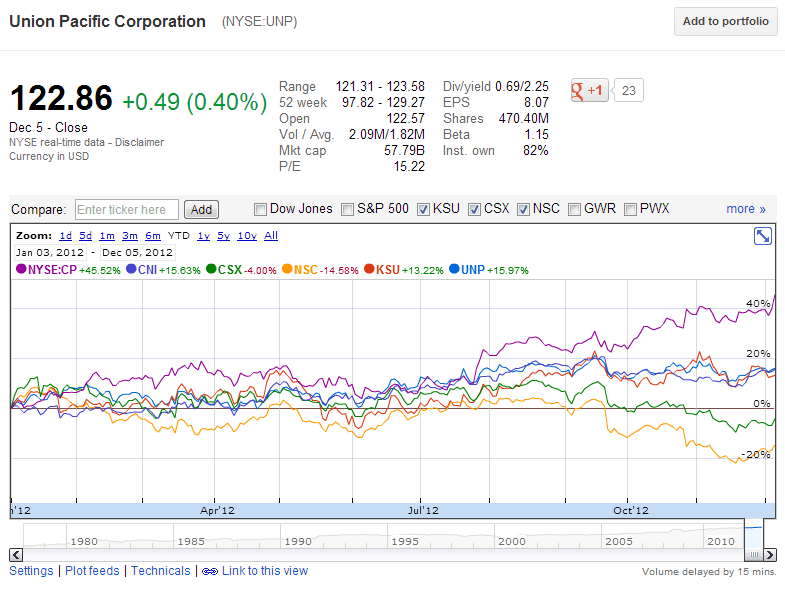
The year-to-date performance of these railroads is shown below:

Click to enlarge


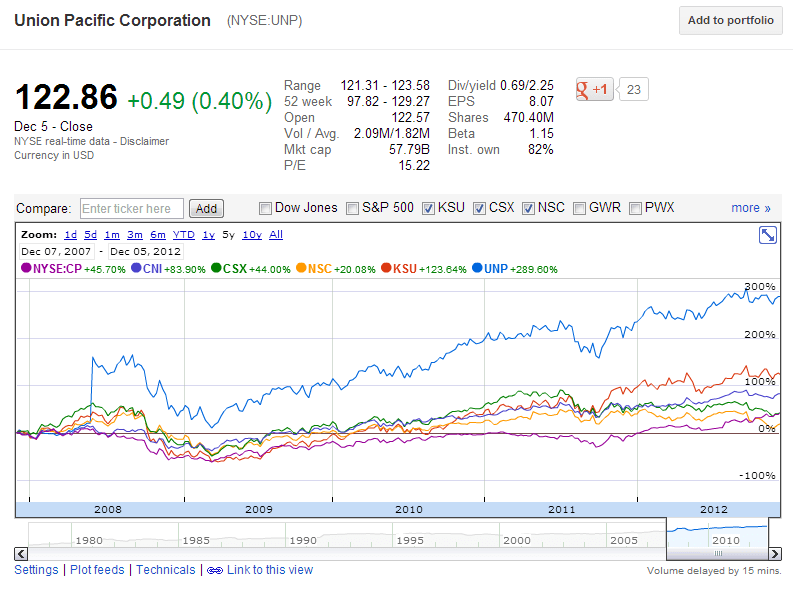
The 5-year performance is shown below:


Canadian Pacific is well ahead of Canadian National this year due to the successful proxy fight by U.S. hedge fund manager Bill Ackman and the subsequent installation of former Canadian National CEO Hunter Harrison as the new CEO of CP. Mr.Harrison is already shaking things up at CP by eliminating 4,500 jobs (or 23% of CP’s workforce)  by 2016 with 1,700 of those jobs by the end of this year.

Disclosure: Long CNI, CSX and NSC

A Look at China’s Major Trade Partners

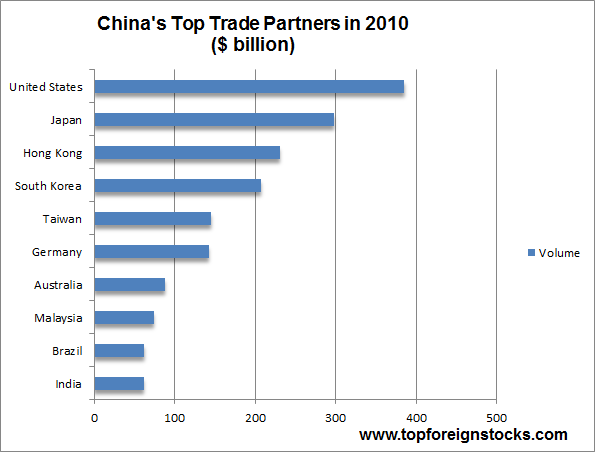
Here is a chart showing China’s top trader partners in 2010, the latest year for which data is available:

Click to enlarge

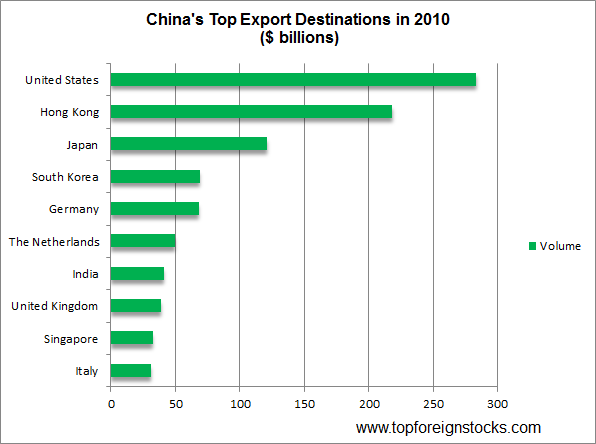
The U.S. was China’s top trader partner and was also the top export destination for China’s exports.Germany had more trade with China than Australia.

China’s Top Export Destinations in 2010:


China’s Top Import Suppliers in 2010:

Data Source: PRC General Administration of Customs, China’s Customs Statistics

Via The US-China Business Council

Ten European ADRs Listed in NYSE Before 2000

Some of the European ADRs trading on the New York Stock Exchange were listed there many years ago. A list of ten such ADRs that were listed in the 1980s and 90s is shown in the table below with their current dividend yields:

S.No.CompanyTickerDividend Yield as of Dec 4, 2012CountryIndustry
1BT GroupBT3.72%United KingdomFixed Line Telecom.
2GlaxoSmithKlineGSK5.29%United KingdomPharma. & Biotech.
3Koninklijke Philips Electronics -PHG3.64%NetherlandsLeisure Goods
4Novo NordiskNVO1.58%DenmarkPharma. & Biotech.
5TOTALTOT5.91%FranceOil & Gas Producers
6NatuzziNTZN/AItalyHouseGoods&HomeConst
7NokiaNOK7.75%FinlandTech.Hardware&Equip.
8STMicroelectronicsSTM6.29%SwitzerlandTech.Hardware&Equip.
9Portugal TelecomPT17.43%PortugalFixed Line Telecom.
10Bank of IrelandIREN/AIrelandBanks

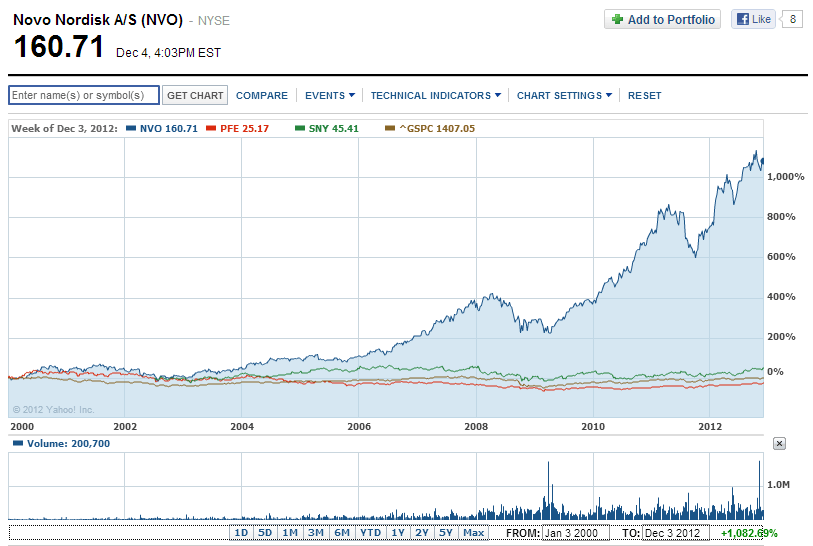
Of the companies noted above, Denmark-based  pharmaceutical firm Novo Nordisk (NVO) has had an incredible run since 2000 growing by over 1,800%. The company offers a range of diabetes products and provides treatments for people with haemophilia, growth hormone deficiency and for women experiencing symptoms of menopause. Its products are marketed in more than 190 countries.Total revenues in 2011 was over $13.0 billion and the profit margin was about 27%. A $10,000 investment in NVO five years ago would be worth $27,160 with dividends reinvested, according to S&P.

A chart showing the performance of Novo Nordisk against France’s Sanofi (SNY), Pfizer (PFE) and S&P 500 is shown below:

Click to enlarge


Source: Yahoo Finance

Disclosure: No Positions

Use of Coal in Electricity Generation of Select Countries

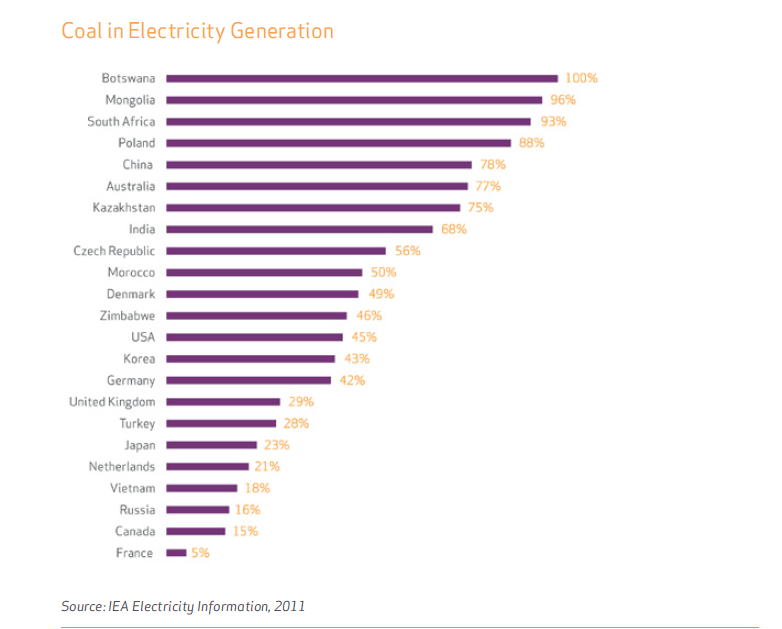
Coal is a major source of fuel for electricity generation in many countries. Relatively cheap and abundantly available, coal will continue to play a significant role in power production for years to come. I came across the following chart showing coal use in electricity generation in select countries:

Click to enlarge


Source: Coal and Electricity Generation, World Coal Association

France depends on nuclear energy for most if its electricity needs. Hence it has the lowest coal use at just 5%. China and India on the other hand, use coal for most of their electricity generation.The U.S. is in the middle of the group generating about 45% of its total electric power from coal. Canada and Russia use other sources of fuel for most of their power production. Though Germany currently has a high percentage of coal use, the country is rapidly moving to other sources for its electricity needs.

Related ETF:

Market Vectors-Coal ETF (KOL)

Disclosure: No Positions