The automotive industry is one of the most important industries not only in developed countries but also in emerging countries. From China to Brazil and most developing countries in between governments are encouraging the growth of this industry. The prevalence of autos is still small in most developing countries compared developed countries. Hence the potential for growth in emerging markets is much higher.
The table below shows vehicle density in select countries:
Click to enlarge
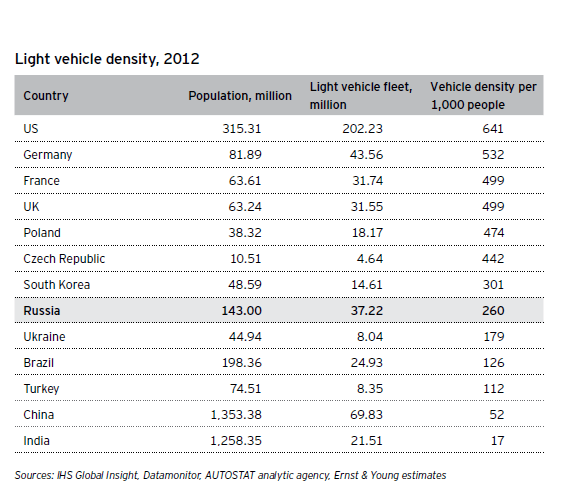
Source: Russian and CIS automotive industry overview, March 2013, Ernst and Young
A few interesting points to note from the above table:
- BRICs have lower vehicle density than developed countries such as the U.S. and Germany.
- With 260 cars per 1,000 people Russia has the highest vehicle density among BRICs and India has the lowest rate.
- Brazil ‘s vehicle density per 1,000 people is higher than India and China’s rates.
- The U.S. has the largest vehicle fleet size and density among developed countries due to the lack public transportation in much of the country.
- Though the U.S. population is roughly double that of Russia’s population, the total light vehicle fleet is about six times that of Russia’s.
- Since the vehicle density is only in the double digits in India and China, automakers have a huge market potential in these countries.