Is It Too Late To Buy Into European Stocks?

European equities have performed well so far this year with most of the major benchmark indices up by double digit percentages similar to the S&P 500. Despite the run up European stocks have more room to grow as most of the economies recover and years of sovereign debt crisis issues are well behind us and not ahead of us. As I have noted in previous articles, European stocks have plenty of room to catch with their American peers. So it is not too late to invest in European companies. Market experts at Charles Schwab emphasized this point in a recent article.

Despite problems, we believe there is an investment case for Europe. Many of Europe’s companies are global, reporting sales in both euros and local currencies. Many of these companies have strong competitive positions in the luxury, technology and industrials industries.

European stocks have room to catch up

SP500_vs_MSCI_EMU Chart

Depressed profit margins also contribute to our positive outlook on European stocks. While profit margins in the United States have risen to a 45-year high, margins in the eurozone have declined since the beginning of 2008. If a modest economic recovery continues as we expect, we believe profits could post even higher growth, and help narrow the performance gap between US stocks and European stocks.

Source:  Schwab Market Perspective: The Way Things Are…, Charles Schwab

Ten European companies are listed below for further research:

1.Company: Siemens AG (SI)
Current Dividend Yield: 2.31%
Sector: Industrial Conglomerates
Country: Germany

2.Company:D iageo PLC (DEO)
Current Dividend Yield: 2.36%
Sector:Beverages
Country: UK

3.Company:Technip (TKPPY)
Current Dividend Yield: 1.49%
Sector:Energy Equipment & Services
Country: France

4.Company: Aegon NV (AEG)
Current Dividend Yield: 3.11%
Sector: Insurance
Country: The Netherlands

5.Company: Edp Energias De Portugal SA (EDPFY)
Current Dividend Yield: 4.22%
Sector: Electric Utilities
Country: Portugal

6.Company:Air Liquide (AIQUY)
Current Dividend Yield: 2.40%
Sector: Chemicals
Country: France

7.Company: Lafarge SA (LFRGY)
Current Dividend Yield: 1.86%
Sector:Construction Materials
Country: France

8.Company: Danone SA (DANOY)
Current Dividend Yield: 2.57%
Sector:Food Products
Country: France

9.Company: Eni SpA (E)
Current Dividend : 5.83%
Sector:Oil, Gas & Consumable Fuels
Country: Italy

10.Company: National Grid PLC (NGG)
Current Dividend Yield: 5.03%
Sector: Multi-Utilities
Country: UK

Note: Dividend yields noted are as of Nov 4, 2013. Data is known to be accurate from sources used.Please use your own due diligence before making any investment decisions.

Disclosure: Long TKPPY

US: An LNG Exporting Country?

U.S. Natural Gas production is rising every year since 2006 due to the success of producing shale gas. As the global demand for Liquified Natural Gas (LNG) is projected to grow over the next few years U.S. may become a major exporter of LNG to other countries competing against established played like Qatar and Russia according to a research report by Societe Generale.

Since LNG is currently exported from many countries with political risks, the U.S. will have the advantage of supply diversity.Despite the advantage the authors of the report identify several factors that may prevent the U.S. becoming a major LNG exporter.

From the report:

First, the LNG approval process may prove long and uncertain.Second, the political debate is really a matter of who will collect the rents associated with an abundance of domestic gas resource: the domestic gas producers vs. the domestic manufacturers. Third, current market conditions do not define long-term commerciality. Higher US gas prices and lower Asian gas prices within the next few years are likely to mitigate the profitability of US LNG exports.

Click to enlarge

US-Gas-Production


Source: US: BECOMING A LNG EXPORTER. Societe Generale

The US has overtaken Russia as the leading producer of LNG and is projected to maintain the top spot at least until the end of this decade.

In addition to the US, currently the major natural gas producing countries are Russia, Qatar, Nigeria, Iran, Malaysia, Algeria, Indonesia and Australia.

The following chart the estimated shale gas resources worldwide noting large large technically recoverable resources (TRR):

Shale-Gas-Resources-Worldwide

It should be noted that the US already exports natural gas by pipelines to Mexico and eastern Canada. However companies are now considering exporting it to other countries by super tankers.

Related ETFs:

United States Natural Gas ETF (UNG)
ProShares Ultra DJ-UBS Natural Gas ETF (BOIL)

Disclosure: No Positions

India’s Sensex Reaches All Time Record High. Should You Invest Now?

The Indian stock market is on a roll with the benchmark Sensex reaching a record high of 21,239 on Nov 3rd in a special trading session celebrating the Diwali festival. The index is up just over 9% year-to-date in local currency terms.

When compared to the performance of developed markets the Sensex return is not that great since most of developed markets are up by double digits this year.Among the BRIC countries, China’s Shanghai Composite is down 5.3% and Brazil’s Bovespa is off by 11.4% YTD. The S&P 500 has shot up by 23.5% in price terms YTD.

Click to enlarge

India-Sensex-LongTerm

Source: Yahoo Finance

Despite the strong rally global investors may want to wait till the beginning of next year to initiate new positions in Indian equities.Some of the reasons for this wait and watch approach are listed below:

  • Much of the gains in Indian stocks has been due to the $31.0 billion or more pumped into the markets by Foreign Institutional Investors (FIIs).
  • Domestic retail investor participation in the equity market is still very low. So this rally may not last long should FIIs pull out their funds any day.
  • The Indian Rupee remains weak and has lost about 12% against the US dollar. So when the Sensex return is considered in US dollars foreign investors have actually earned a negative return.
  • Much-needed economic reforms have pretty much stalled due to bickering among political parties.
  • Corporate earnings have been average or even lower than last year. Hence the run up in share prices is not fully
    justified by earnings growth.

On the positive side, India’s Central Bank is now run by Raghuram Rajan, a former chief economist of the International Monetary Fund and a University of Chicago professor and a supporter of free market policies.In addition, certain parts of the economy such as the export-oriented IT, banking, consumer sectors remain strong. So investors can still believe in the the Indian growth story. But due to the elevated valuations of stocks and other reasons mentioned above, they can monitor the equity market over the next two months and consider investing in January of next year.

Related ETFs :

  • EGShares India Infrastructure ETF (INXX)
  • WisdomTree India Earnings (EPI)
  • PowerShares India (PIN)
  • iShares S&P India Nifty 50 (INDY)
  • Market Vectors India Small-Cap Index ETF (SCIF)

Disclosure: No Positions

Related:

A Sensex gone awry (The Hindu)

The Top 10 Foreign Stocks Trading On The OTC Markets

Many foreign companies trade on the OTC markets in the U.S. instead of the organized exchanges like NYSE or NASDAQ. Some of these firms fled the organized exchanges to the OTC market in the recent past to avoid higher reporting requirements due to the Sarbane-Oxley Act, higher listing fees, low trading volumes and other reasons. So US investors looking to gain exposure to foreign markets have to explore opportunities available via the OTC markets and not simply restrict themselves to the stock listed on the exchanges.

A common misconception among investors is that companies trading on the OTC markets are penny-stocks and are  prone to all types of fraud. However that is not true since many world-class foreign firms trade on the OTC markets.

The table below lists the Top 10 OTC-traded Foreign Stocks by Market Capitalization:

S.No.CompanyTickerMarket Capitalization (as of Nov 1, 2013)IndustryDividend Yield (as of Nov 1, 2013)Beta
1 Roche Holding Ltd.RHHBY $191.3B Pharmaceuticals 2.79% +0.8
2 Bayer AGBAYRY $102.1B Pharmaceuticals 2.01% +1.2
3 LVMH Moet Hennessy Louis Vuitton SALVMUY $95.6B Textiles, Apparel & Luxury Goods 1.98% +1.4
4 BASF SEBASFY $95.1B Chemicals 3.29% +1.7
5 Australia and New Zealand BankingANZBY $86.7B Commercial Banks 4.68% +1.6
6 National Australia Bank Ltd.NABZY $79.4B Commercial Banks 5.25% +1.7
7 Allianz SEAZSEY $76.0B Insurance 3.53% +2.0
8 Volkswagen AGVLKAY $72.2B Automobiles 1.86% +1.4
9 Deutsche Telekom AGDTEGY $70.3B Diversified Telecommunication Services 5.86% +0.9
10 BG Group plcBRGYY $68.9B Oil, Gas & Consumable Fuels 1.93% +0.9


A few observations:

  • Swiss-pharma giant tops the list with a market cap of over $191.0 billion.
  • Five of the ten companies are from Germany. Bayer (BAYRY). BASF (BASFY), Allianz (AZESY), Volkswagen (VLKAY), Deutsche Telekom (DTEGY) are also components o f the benchmark DAX index.
  • Australian banks Australia and New Zealand Banking (ANZBY) and National Australia Bank Ltd (NABZY) have dividend yields are over 4% and 5% respectively and are excellent choices for long-term investment.

Disclosure: No Positions

On The Impact of Currency Gyrations On Emerging Market Equities

One of the factors that investors consider when investing in emerging market equities is the stability of local currency against the US dollar. Generally currency depreciation is assumed to have an adverse impact on equities in an emerging country. However that assumption is not always correct and does not apply to all emerging markets. According to a research report published by AXA Investment Managers, the impact of currency depreciation varies based on the “openness” of the market in question and the sector composition of equity indices. In other words, some emerging markets are more domestic than others meaning that companies generate more of their revenues domestically than from foreign countries. Hence such companies are unable to leverage the fall in exchange rate to increase their market share by selling goods cheaper to their overseas customers. So companies that are more dependent on foreign revenues are sensitive to currency gyrations than the ones that are mostly domestic-oriented.

The share of revenues generated domestically is higher for the companies in the MSCI indices of China, India and Brazil than their peers. Public companies in Taiwan and South Korea for example, generate a larger share of their revenues overseas. Hence their earnings are affected by volatility of currency movements.

Incidentally when many emerging market currencies including the Indian Rupee plunged earlier this year on fears of the Fed winding down its monthly $85 billion asset purchases, the Indian equity market barely fell.

Click to enlarge

Emerging-Markets-MSCI


Source: FX depreciations are not necessarily good news for EM earnings, AXA Investment Managers

From the report:

In the case of Brazil and India, the large share of domestic revenues is to some extent explained by the substantial weight of financials in their respective equity indices (28% and 31% of MSCI Brazil and MSCI India’s total market capitalisation, respectively). EM financials are usually strongly domestic – 98% of the revenues of MSCI Brazil financials are domestic, while the figure is 96% for MSCI India financials. Moreover, financials are relatively immune to FX movements. Similarly, companies in the energy sector in Brazil (representing 17% of the MSCI Brazil’s market capitalisation) earn 88% of their revenues in Brazil. Given that a large part of their production is also local, they are naturally hedged against exchange rate fluctuations.

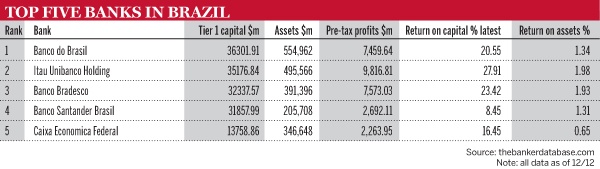
Hence from an investment standpoint, Brazilian and Indian financials will mirror the performance of the domestic economy and may not be highly impacted by outside factors such as currency rate fluctuations, the policies of the US Federal Reserve, the state of developed world economies, war in Syria, etc. Brazilian and Indian banks trading on the US exchanges are listed below with their current dividend yields for further research:

1.Company: Itau Unibanco Holding SA (ITUB)
Current Dividend Yield:  2.96%
Sector: Banking
Country: Brazil

2.Company: Banco Bradesco SA (BBD)
Current Dividend Yield: 0.90%
Sector: Banking
Country: Brazil

3.Company: Banco do Brasil S.A. (BDORY)
Current Dividend Yield: 8.72%
Sector: Banking
Country: Brazil

4.Company: Banco Santander (Brasil) S.A. (BSBR)
Current Dividend Yield: 3.62%
Sector: Banking
Country: Brazil

5.Company: ICICI Bank Ltd. (IBN)
Current Dividend Yield: 1.80%
Sector: Banking
Country: India

6.Company: HDFC Bank Ltd. (HDB)
Current Dividend Yield: 0.73%
Sector: Banking
Country: India

Note: Dividend yields noted are as of Nov 1, 2013. Data is known to be accurate from sources used.Please use your own due diligence before making any investment decisions.

Disclosure: Long ITUB and BBD