Gold is traditionally considered as a safe heaven asset and a hedge against inflation. Investors piled into Gold during times of economic uncertainty such as the period after the recent global financial crisis. In addition, gold is one of the preferred asset class for investors who lack faith in the current fiat currency system which allows countries to countries spend like drunken sailors without suffering the consequences at least in the short-term. This scenario is especially true in most of the the developed world where continuous economic growth is encouraged even if it means piling onto more debt.
Gold prices fell 28% in 2013 and closed at $1,202.30 an ounce in New York. According to a Bloomberg article, this is the first loss since 2000 and the biggest since 1981. From the article:
12-Year Rally
Gold surged more than 500 percent in the 12 straight years of gains through 2012 as the dollar weakened. The rally accelerated from December 2008 to June 2011 as the Fed expanded its balance sheet through debt purchases and held borrowing costs at a record low in a bid to revive growth amid a U.S. recession. Bullion reached a record $1,923.70 in September 2011.
“While there are no immediate worries about inflation, it can’t be ruled out in the future with economic growth accelerating in some parts of the world,” said Jeff Sica, who helps oversee more than $1 billion of assets as president of Sica Wealth Management in Morristown, New Jersey. “Gold will find support at lower prices with interest rates hovering near zero.”
The following chart from a December 20, 2013 article in The Wall Street Journal shows the dramatic rise in gold prices since 2003 and the following decline:
Click to enlarge
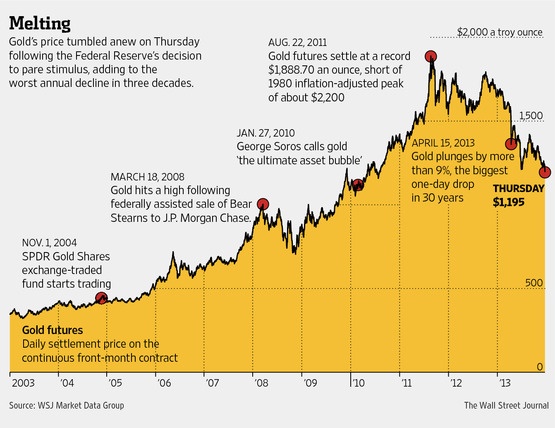
Source: Gold Is Testing ‘Last Ditch Support’ Before It Falls Further Into the Abyss, The Wall Street Journal
Since 1972 Gold has had at least 14 bear markets – defined as a fall of 20% or more as the table shows below:
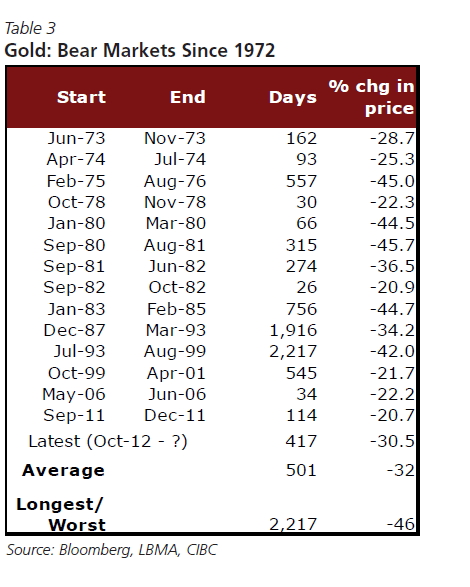
Source: A Look to the Future – 2014 Edition, CIBC World Markets
During bear markets lasting more than 500 days gold prices fell over one-third with exception of Oct-99 to Apr-01 period when it fell only about 22%.
CIBC World Markets projects gold has further to fall this year. They have a 2014-end a target of $1,000 an ounce. That would imply a decline of more than 15% from the current level.
Related ETF:
- SPDR Gold Trust ETF (GLD)
Disclosure: No Positions