A Review of the MSCI Emerging Markets Index

The  MSCI Emerging Markets Index gives exposure to large and mid-cap companies in 21 emerging markets that include: Brazil, Chile, China, Colombia, Czech Republic, Egypt, Greece, Hungary, India, Indonesia, Korea, Malaysia, Mexico, Peru, Philippines, Poland, Russia, South Africa, Taiwan, Thailand and Turkey. At the end of 2013, the index had 824 constituents.

The chart below shows the country weights in the index:

Click to enlarge

MSCI Emerging markets Country Composition


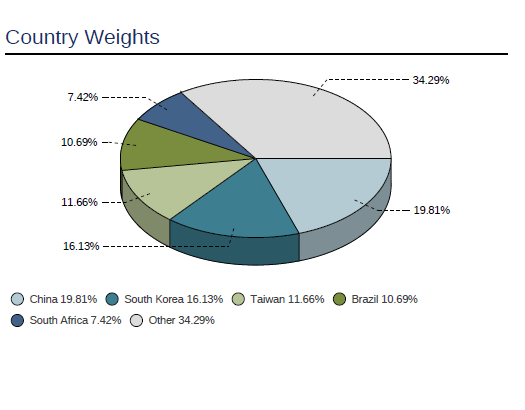
China accounts for the largest allocation at nearly 20%. Chinese equities have not performed well in the past few years and generally there are plenty of risks investing in Chinese companies including lack of transparency, state-ownership, etc. Hence investing in an emerging market ETF such as the iShares MSCI Emerging Markets ETF (EEM) which has net assets of over $28.0 billion involves high exposure to China.

In terms of sector allocation, financials account for over one-fourth of the index followed by IT:
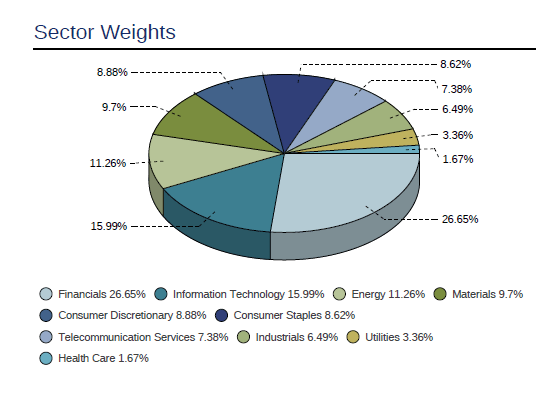
MSCI Emerging markets Index Sector Weights

Source: MSCI

The dividend yield of the index at the end of last year was 2.60%. This yield is higher than the average yield of about 2% for the S&P 500.

The Top 10 Components in the index are: Samsung Electronics, Taiwan Semiconductor(TSM), Tencent Holdings (TCEHY), China Mobile(CHL), China Constructions, Gazprom (OGZPY), ICBC, Naspers, America Movil (AMX)and MTN Group (MTNOY)of South Africa.

Disclosure: No Positions

Which Emerging Markets To Consider For Investment

Emerging markets have not performed well so far this year. Up until a few years ago emerging markets were the place to be for global investors seeking explosive growth. But economic growth in these markets has slowed sigificnatly due to the slowdown in the Chinese economy and other factors. As a result emerging markets have lost their attraction not only to foreign investors but also domestic investors.

The year-to-date returns of the some major emerging markets are listed below:

China’s Shanghai Composite: -3.2%
India’s Bombay Sensex: 2.8%
Brzail’s Sao Paulo Bovespa: -8.0%
Chile’s Santiago IPSA: -2.3%
Mexico’s IPC All-Share: -6.3%

By comparison, the benchmark equity indices of the U.S. and most developed markets are in the positive terrritory with the S&P 500 up by 1.0% YTD.

As most investors are avoiding emerging markets, now may be the time to take the contrarian view and invest in these markets. From a recent article by Jason Zweig of the Journal:

The great British biologist J.B.S. Haldane said that ideas pass through four stages of acceptance: 1, “worthless nonsense”; 2, “interesting”; 3, “true, but quite unimportant”; and 4, “I always said so.”

Among investors, stage four never lasts long; complacency breeds carelessness. So stage four often leads abruptly right back to stage one, at which point the cycle starts all over again.

By 2012, emerging-market investors were in the “I always said so” phase. Now they are moving toward the “worthless nonsense” phase. That is when you should get seriously interested.

Source: Emerging Markets Look Appetizing…Again, The Wall Street Journal, Feb 28, 2014

Another article on emerging markets in FT’s beyondbrics blog provided some insights in selecting emerging countries for potential investments. From the article:

The markets worst hit so far tend to be those of countries that share some combination of the following: a hefty current account deficit, significant amounts of short-term debt denominated in foreign currencies, depreciating currencies, rising domestic inflation and an unorthodox central bank governor.

Relative havens, therefore, would be places that exhibit several of the opposite characteristics. Mexico, Taiwan, South Korea and Malaysia stand out, particularly because of strong manufacturing bases that are set to benefit from a resurgence of consumer demand in the US and Europe, Mr Ganske says. The Philippines is another country with a current account surplus.

Conversely, though, big commodity exporters such as Brazil, Russia and Kazakhstan are seen as less attractive because China – the global magnet for resource imports – is showing signs of slowing growth.

Source: EM haven hunt turns up few bargains, Feb 3, 2014, FT beyondbrics

Five emerging market ADRs are listed below with their current dividend yields for consideration:

1.Company:Fomento Economico Mexicano SAB de CV (FMX)
Current Dividend Yield: 3.76%
Sector:Beverages
Country:Mexico

2.Company:Taiwan Semiconductor Manufacturing Co Ltd (TSM)
Current Dividend Yield: 2.12%
Sector: Semiconductors & Semiconductor Equipment
Country:Taiwan

3.Company: Posco (PKX)
Current Dividend Yield: 2.27%
Sector: Metals & Mining
Country:South Korea

4.Company: Malayan Banking Berhad (MLYBY)
Current Dividend Yield: 6.03%
Sector: Banking
Country:Malaysia

5.Company:Philippine Long Distance Telephone Co (PHI)
Current Dividend Yield: 4.73%
Sector: Telecom
Country: Philippines

Note: Dividend yields noted above are as of Mar 21, 2014. Data is known to be accurate from sources used.Please use your own due diligence before making any investment decisions.

Disclosure: No Positions

Related:

Buy Sheep, Avoid Goats of Emerging Markets (Bloomberg)


The Evolution of Modern Ukraine

This week Crimea and the city of Sevastopol joined Russia. Or put another way, Russia annexed Crimea and the city of Sevastopol from Ukraine. Regardless of how we look at this, the simple fact is Ukraine lost territory and Crimea is now part of Russia. The only thing left is to make sure that the rest of Ukraine does not fall apart since the economy is in shambles and the Eastern Ukraine wants to join Russia.

Here is a fascinating time lapse video of the map of Europe over the past 100 years:

Source: Frank Reed

The map below shows the Evolution of Modern Ukraine:

Click to enlarge

Ukraine Map Evolution

Source: The Voice of Russia

Note that the map says Crimea divorced Ukraine in March, 2014. Russians have a sense of humor too.

What does Russia get economically with the incorporation of Crimea?  English Russia lists 25+ things Russia gained by annexing Crimea.

A Comparison Of Global Dividend Payouts

Many companies across the world have been increasing their dividend payouts to shareholders in the past few years. Global dividend payouts reached  a record $1.04 Trillion in 2013, a growth of 43% from 2009 according to research by Henderson Global Investors.

The following chart shows the global dividend payout by region:

Click to enlarge

Dividends Paid by Region


Source: Henderson Global Investors via Income Investor, March 2014, CityWire UK

Some observations on the above chart:

  • North American companies account for the largest share of global dividends due to the sheer size and scale of the market. If US firms cut down the amount of their share buybacks and instead raise their dividends then North America’s share of global dividends would rise even higher.**
  • While North American firms’ dividend payouts in 2013 surpassed the payouts in 2009, European firms’ payouts lagged. 
  • British companies accounted for 11% of global dividends with Vodafone(VOD), Royal Dutch Shell plc (RDS-A) and HSBC Group (HBC)among the top payers. 
  • Dividend payouts by companies in emerging markets has doubled between 2009 and 2011 before flattening recently according to Henderson data.
  • Half of the emerging market dividends come from the BRIC countries.

Some of the Top Global Dividend Stocks in 2013 are shown in the chart below:

Click to enlarge

Top Global Dividend Payers in  2013

This list is dominated  by oil, consumer goods, pharma companies and a few banks. Investors looking to add global dividend stocks to their portfolios can use the above list as a good starting point.

Update:

In 2013, U.S. companies in the Russell 3000 index bought back $567.6  billion of their own shares – a 21% percent over in 2012 according to Birinyi Associates quoted by Jason Zweig of The Wall Street Journal.

Since 2005, the total share buybacks of U.S. firms have amounted to $4.21  Trillion (or ) about one-fifth of the total value of U.S. stocks today.

Source: Stock Buybacks: Will they bite back?, The Wall Street Journal, Mar 22, 2014

Disclosure: Long Banco Santander

On The Long-Term Performance of Germany’s DAX Index

The benchmark stock market index of Germany is the DAX Index. The index is comprised of 30 blue-chip German companies trading on the Frankfurt Stock Exchange. The index was created in 1988.

Any investor looking to invest in European companies have to firs consider the German market since the country is the economic powerhouse of Europe and is the largest economy in Europe. Accordingly the long-term returns of German stocks is excellent. The following chart shows the 25-year performance of the index (in green) through May 2013:

Click to enlarge

DAX Long Term Returns

Source: 25 Years of the DAX: Wealth for Everyone, Allianz Global Investors

An investment in the DAX index at the time it was created and held thru 2013 would have earned spectacular returns .From the Allianz Global Investors report:

In hindsight, there is no doubting that the DAX has created wealth. It has increased more than eightfold in its nearly 25 years of existence. Put another way: Someone who put 1,000 (or close to 2,000 DM) euros into the DAX back then would have around 8,500 euros at the end of May 2013. It has been, despite all the highs and lows, a good investment. It’s interesting to note: 46 % of DAX performance came from dividend distributions. In fact, dividends provide for an overall calmer path for performance, but this is hardly noticed in the custody account, since dividends flow out of the account while share prices fluctuate.

It is interesting that nearly half (or 46%) of the total returns came from dividends. This is not surprising since French and German firms are some of the biggest dividend payers on the continent.

Related ETF:

  • iShares MSCI Germany (EWG)

Disclosure: No Positions