Knowledge is Power: Tax-Efficient Investing, European Banks, Japan Edition

Capitalism is making way for the age of free (Guardian)

Star managers warn over rush into Europe (Trustnet)

Is Russia too risky to buy now? What about China? (MoneyWeek)

Shiozumi: Japan isn’t even halfway through its bull market (CityWire)

European banks’ results: The long and winding road (DB Reseeach)

Gen Y: Don’t believe the hype on home ownership (The Globe and Mail)

The race to be Canada’s first $1-trillion bank (Maclean’s)

The Importance of Tax-Efficient Investing (Charles Schwab)

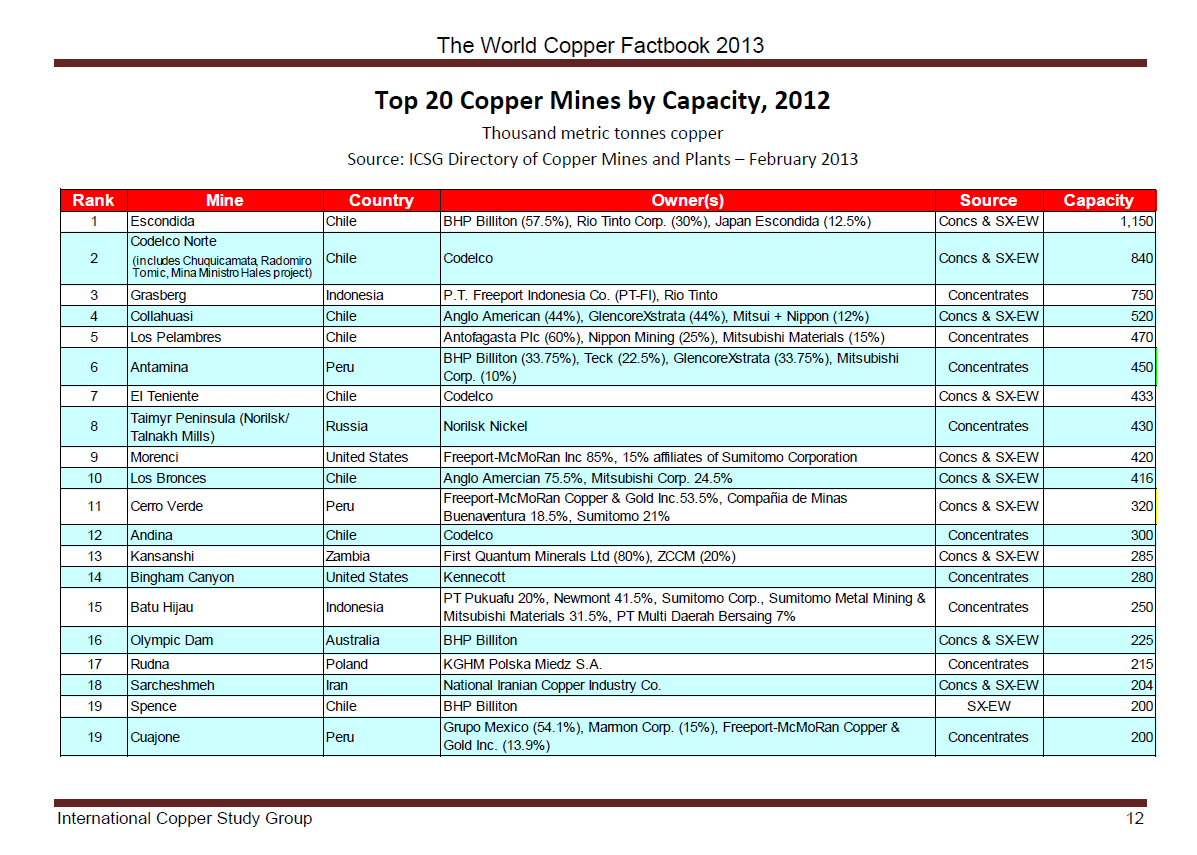
Top 20 Copper Mines Worldwide

Source: Copper Development Association
Hunting for Bargains Among European Stocks

Most European equity markets performed very well last year. The performance has varied widely so far this year with a handful of markets such as Portugal, Denmark and Italy up by double digit percentages. While a few years ago investors abandoned stocks in the PIIGS countries now they are returning to these countries in the hope that the worst is over.

The year-to-date return of some of the European indices are listed below:

  • UK’s FTSE 100: -2.0%
  • France’s CAC 40: 2.7%
  • Germany’s DAX: 0.40%
  • Italy’s MIB: 13.3%
  • Portugal’s PSI 20: 15.5%
  • Spain’s IBEX 35: 4.2%
  • Denmark’s OMX Copenhagen: 12.6%

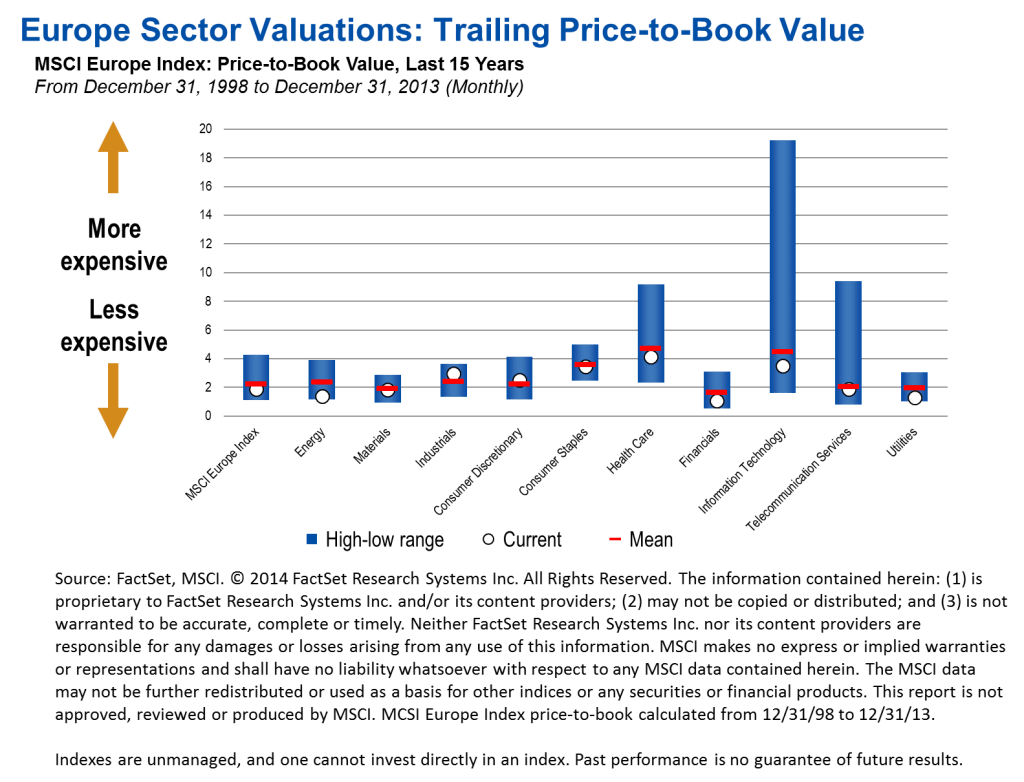
Though European stocks have had a strong run last year and have risen again this year, they have still room to run and valutions are attractive in many sectors from a historical Price-to-Book standpoint according to Lisa Myers of Templeton Global Equity Group.  In an article titled “Pockets of Opportunity in Europe, Emerging Markets” she noted that companies in the pharmaceutical,biotechnology, healthcare equipment, oil services, IT  and financials have further potential for growth.

The following chart shows the sector valuation based on the MSCI Europe Index for the past 15 years:

Click to enlarge

 Europe Sector Valuations


Source: Pockets of Opportunity in Europe, Emerging Markets, Lisa Myers, Templeton Global Equity Group, Mar 18, 2014

Investors looking to add some European stocks can consider some of the companies listed below:

1.Company: Nordea Bank AB (NRBAY)
Current Dividend Yield: 3.23%
Sector: Banking
Country: Sweden

2.Company: Electricite de France SA (ECIFY)
Current Dividend Yield: 4.25%
Sector: Electric Utilities
Country: France

3.Company: HSBC Holdings plc (HSBC)
Current Dividend Yield: 4.82%
Sector: Banking
Country: UK

4.Company: Fresenius Medical Care AG & Co. KGAA (FMS)
Current Dividend Yield: 0.98%
Sector: Health Care Providers & Services
Country: Germany

5.Company: Telenor ASA (TELNY)
Current Dividend Yield: 4.63%
Sector: Telecom
Country: Norway

6.Company: BNP Paribas SA (BNPQY)
Current Dividend Yield: 2.52%
Sector: Banking
Country: France

7.Company: Roche Holding AG (RHHBY)
Current Dividend Yield: 2.59%
Sector: Pharmaceuticals
Country: Switzerland

8.Company: Technip SA (TKPPY)
Current Dividend Yield: 2.12%
Sector: Energy Equipment & Services
Country: France

9.Company: Novartis AG (NVS)
Current Dividend Yield: 2.17%
Sector: Drugs
Country: Switzerland

10.Company: GlaxoSmithKline plc (GSK)
Current Dividend Yield: 4.58%
Sector: Pharmaceuticals
Country: UK

Note: Dividend yields noted above are as of Mar 28, 2014. Data is known to be accurate from sources used.Please use your own due diligence before making any investment decisions.

Disclosure: Long TKPPY

On The Correaltion Between Real Per Capita GDP Growth and Equity Returns

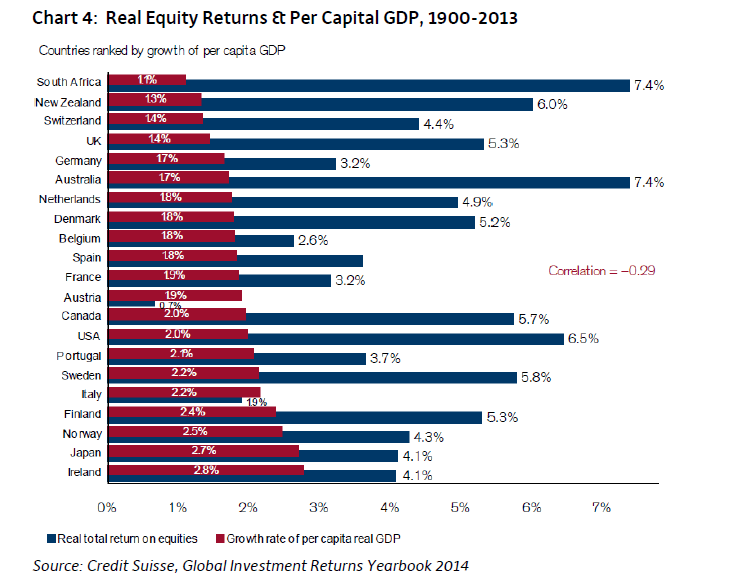
Higher economic growth does not necessarily mean higher equity returns especially in the long terms. Many research studies have confirmed this theory. On a similar vein, higher wealth generation as measured by real per capita GDP growth does not necessarily mean higher real equity returns. The correlation between these variables over the very long-term is negative. So investors should not assume that simply because a country becoming richer will translate into higher equity returns.

The chart below shows the negative correlation between real per capita GDP growth and equity returns for most of the developed world and one emerging country: 

Click to enlarge

Real Per Capita GDP Growth and Equity Returns Correaltion

via The Absolute Return Letter, Absolute Return Partners, Mar 2014

A few observations from the above chart:

  • The emerging country of South Africa had the lowest per capita GDP growth but yielded the highest equity returns during the period shown. As a commodity-based economy South Africa firms benefited from the growth of commodity demand over the past century generating higher equity returns.Another factor that can be considered is that most South African companies pay out about 50% of their earnings to shareholders in the form of dividends.
  • The U.K. had higher equity returns than Germany despite a lower growth in per capita GDP.
  • Similar to South Africa, Australia also had the highest equity returns  at 7.4% despite a low per capita GDP growth of just 1.7%. The factors we discussed earlier for South Africa probably can be applied to Australia as well.
  • Ireland had the highest per capita GDP growth but the equity returns were average.
  • The U.S. had above above-average returns with a lower per capita GDP growth for the period shown.


It should be noted however that over very very long-term such as over a century equity returns are affected by many factors including rare events like World Wars. Since 1900, the world has seen World War I and II. During these events the economic impact on some countries were more severe than others. For example, during World War II the economies of Australia, Canada and the U.S. grew while much of the European economies particularly Germany’s was devastated as the allies crushed the Nazi regime. It took years and massive economic aid for Germany’s economy to recover. Today the German economy is the largest in Europe.

Related ETFs:

  • iShares MSCI Germany Index Fund (EWG)
  • iShares MSCI Canada Index Fund (EWC)
  • iShares MSCI Australia Index Fund (EWA)
  • SPDR S&P 500 ETF (SPY)

Disclosure: No Positions

Should You Invest in Emerging Markets for the Very Long-Term ?

One of the questions facing investors in emerging market equities is whether they should buy stocks and hold for the long-term or even very long-term. Generally long-term can be defined as investment periods of 5-10 years while longer periods can be considered as the very long-term.

In this article let us analyze this issue and try to come up with possible conclusions.I will use India as an example since has become the hot destination for foreign investors recently.Other emerging markets such as Indonesia, Turkey, Mexico, Brazil, China, etc.also share similar characteristics as the Indian market and hence the conclusions drawn from the Indian context can be extrapolated to other markets.

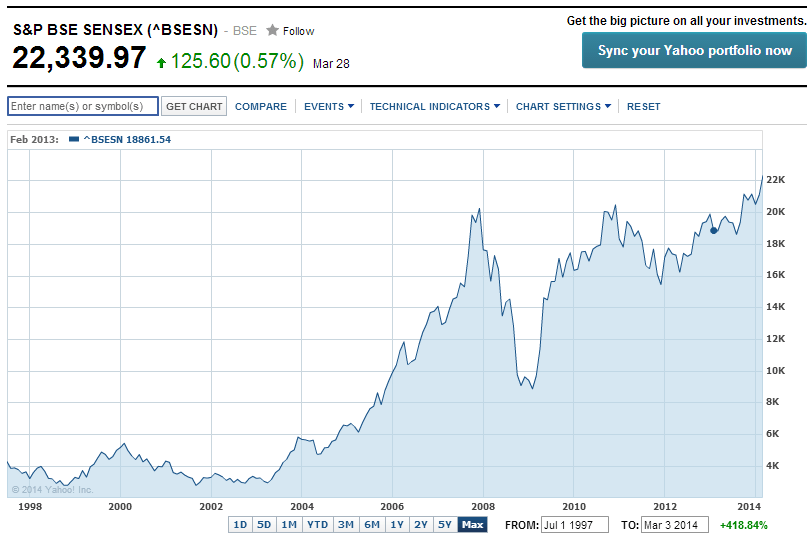
India’s benchmark stock market index Sensex closed at a record 22,339 yesterday. Indian stocks have been soaring many months now based on the expecation that the opposition candidate Narendra Modi will win in the upcoming election and
become the leader of the world’s second most populous country. He is considered to be highly business-friendly.Foreign and domestic investors are betting that he will rekindle India’s economic growth that has stagnated in the past few years.As a result the Sensex has risen from 18,000 last August to over 22,000 now.It remains to be seen if the current rally continues after the election results are announced in early May.

The long-term performance of the Sensex is shown below:

Click to enlarge

Sensex Long Term Return Chart

Source: Yahoo Finance

In addition to the nice long-term performance, the index had rebounded sharply in the past five years and has more than doubled.

A recent article in The Hindu BusinessLine by Aarati Krishnan discussed some of the problems with investing in the Indian stock market over long periods. The aptly titled “Why we are short on going long” piece was based on a study of the performance of listed Indian stocks over the past two decades. The results of the study demolished some of the myths of equity investing such as the buy-and-hold strategy followed by long-term investors.

Here are some fascinating points from the study:

  • The annualized return on the Sensex over the 20 year period from 1994, the annualized return was 8.50%. Though this seems decent, actually this is not good for an emerging market such as India considering inflation and other factors during the time period. The 8.50% assumes that an investor in the original Sensex adjusted the portfolio every time the index components changed.
  • By now eight of the blue-chips of the index lost money, two became penny stocks and a dozen of them are now unrecognizable due to mergers and restructuring.
  • An investor who invested in a company back in 1994 had a two-in-three chance of losing money had they held the original investment all through the 20 years.
  • Two-thirds of the 1700 listed stocks lost money during the study period.
  • 80% of the stocks generated less than 10% annual return which is low as mentioned earlier.
  • The strategy of Buy-and-hold investing worked better for shorter holding periods such as five and ten years as opposed to the very long-term of 20 years.
  • Though a few stocks generated enormous wealth if held during the 20 year period, an investor had a one-in-ten chance of uncovering such gems.

Source: Why we are short on going long, The Hindu BusinessLine, Mar 2, 2014

In conclusion, some of the key takeaways for investors to remember when investing in any emerging market are:

  • In emerging markets, investors have to be very selective in picking stocks. Also timing is also critical since emerging markets are more volatile than developed market. For example, Brazilian miner Vale(VALE) rode the global commodities boom before falling hard in the past five years when the demand for commodities such as iron ore, copper, etc. collapsed. The stock is down about 11% in past five years. On the other hand,  Mexican beverage company Fomento Económico Mexicano, S.A.B. de C.V (FMX) performed well during the same period soaring by 230% excluding dividends. Fomento is a bottler and distributor of Coca Cola products in Mexico, Central America, Colombia, Venezuela, Brazil, Argentina, Costa Rica, Guatemala, Nicaragua, Panama, and the Philippines.
  • Investing for the very long-term such as twenty or more years may not work work.
  • Simply buying and holding stocks over long periods is also not a good idea in emerging markets.
  • Seemingly solid blue-chips can crash dramatically. For example, oil giant Petrobras(PBR) of Brazil fell from about $70 in mid-June 2008 to as low as $10 a share before recovering to about $13 now.

Related ETFs:

  • WisdomTree India Earnings (EPI)
  • PowerShares India (PIN)
  • iShares S&P India Nifty 50 (INDY)
  • iShares MSCI Mexico Investable Market Index (EWW)
  • iShares MSCI Brazil Index (EWZ)

Disclosure: Long PBR

The Top Trade Partners of Russia

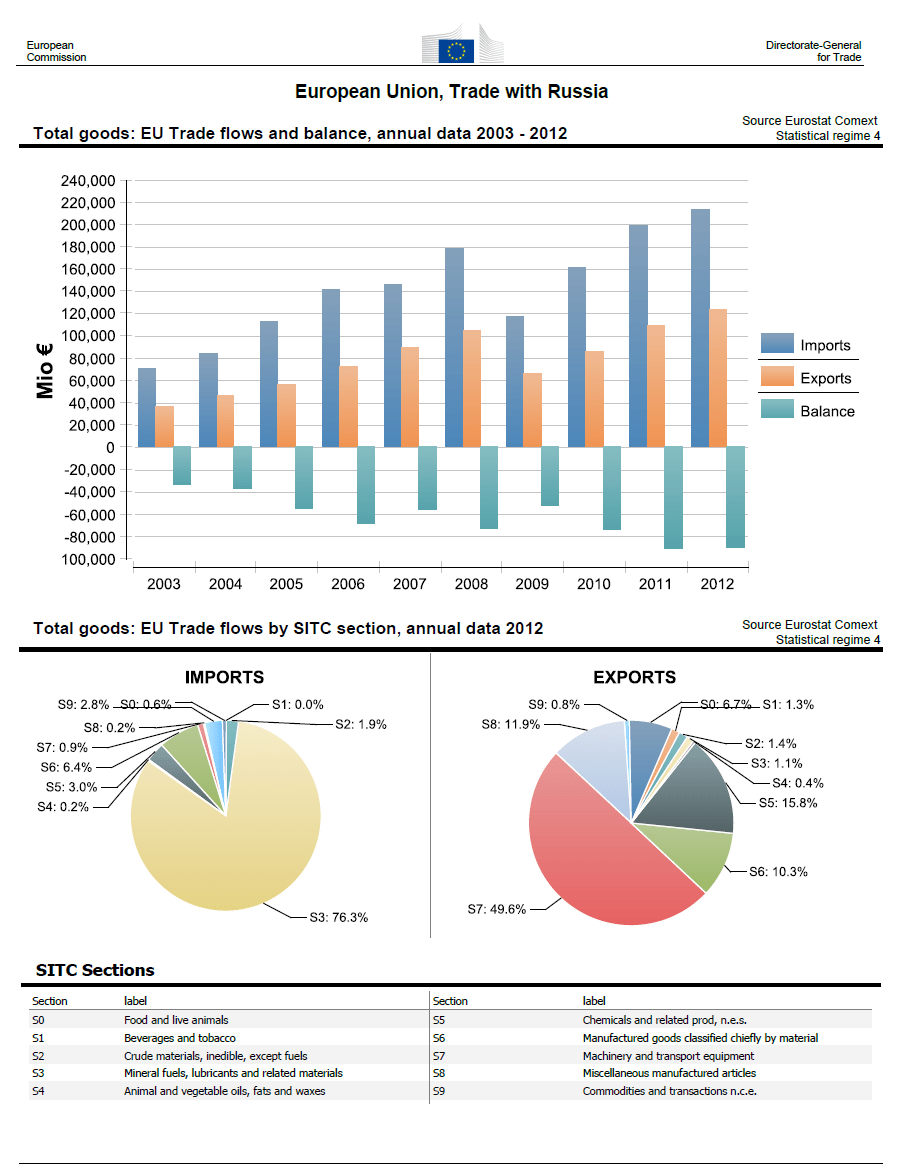
The European Union is the largest partner of Russia. The EU is largely dependent on Russia for natural gas, oil and related materials as shown in the chart below. In terms of exports of Russia, the EU exports a lot of machinery,equipment , autos and other goods. Trade between the EU and Russia has rises almost consistently sine 2003 with imports from Russia higher than exports to Russia.

The EU’s Trade with Russia is shown in the charts below:

Click to enlarge

EU Trade with Russia 2012

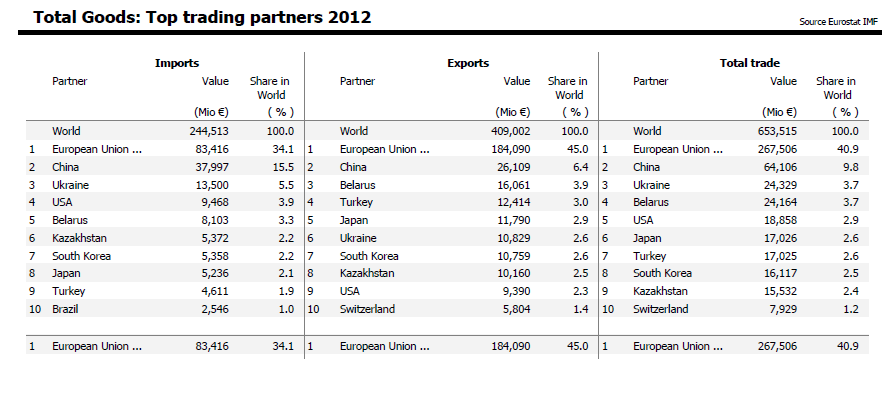
Russia’s trade with the U.S. is a tiny and accounted for less than 3% in 2012. The chart below shows the top trader partners of Russia in 2012:

Top trade Partners of Russia 2012

The EU amounted to about 41% of Russia’s good trade with the world followed by China, Ukraine and Belarus.

Source: Europa

Also Checkout: ING International Trade Study by ING