Value of Assets on Central Bank Balance Sheets vs. the SP 500

Quantitative easing and negative interest rate policies followed by major central banks in the past few years have been a disaster for savers. However these policies have been a boon to equity investors as asset prices have soared. The following chart shows the relationship between the value of assets on central bank balance sheets vs. the S&P 500 index:

Click to enlarge


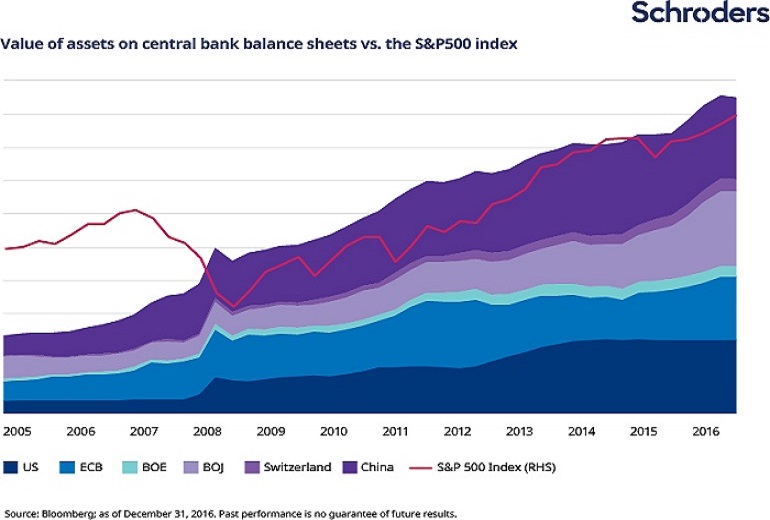
Source: Investors should prepare for liquidity inflection point, Schroders

The Roller Coaster Of Investor Emotion: Chart

Yesterday major US equity market indices fell sharply after many months of strong gains and record highs. After the initial euphoria of the current administration wore off, stocks have been stuck in steady state for a few weeks now. Elevated stock prices and political drama unfolding in DC led stocks to their deepest decline so far this year with the Dow falling 1.78% and the S&P declining 1.82%.

When markets enter such volatile periods it is important to keep emotions in check and focus on the long-term goals. The following chart shows the roller coaster of emotions that most investors go thru:


Click to enlarge


Source: A further 21 great investment quotes by Dr.Shane Oliver, AMP Capital Investors

Why Investors Can Just Avoid Japanese Stocks

The Japanese equity market is one of the worst markets among developed markets. For years investors have been let down by the performance of Japanese stocks. Once in a few years it seems like things start to turnaround only the rally to peter out. There are many reasons why investors may just want to ignore investing in Japan. A  few of the reasons include:

  • Poor management of companies in terms of governance, transparency, etc.
  • Shareholder unfriendly policies.
  • Low payout of profits to investors in the form of dividends and buybacks.
  • Low participation rate of domestic investors in equity markets.
  • Sometimes the Bank of Japan is the largest shareholder in many large companies.

The current dividend yield on the Nikkei is just 1.79%. This is one of the lowest among developed markets and is lower than the yield of S&P 500.

Recently I came across a few articles on the Japanese equities. Prof.  Aswath Damodaran is bullish on Japan. From an article at FT Alphaville:

Using data from Aswath Damodaran, which covers the full set of listed Japanese companies excluding financials, the EV/EBITDA ratio is about 7.4, compared to more than 12 for the US. (For Western Europe, the figure is about 9.4.) Damodaran’s data only go back a few years, but his figures show that Japanese companies went from being about 1.6 times as expensive as American ones, relative to underlying earnings, to 0.6 times as pricey.

The chart below compares the valuation of the Topix index of larger Japanese companies with the S&P 500 index. It’s an imperfect demonstration of the unusual gap in relative valuations, but it does provide a flavour of how tUS stocks too expensive? Consider Japanhe current situation compares to history:

Japanese stock prices have more or less doubled since it became clear Abe Shinzo would become prime minister near the end of 2012. Japanese corporate profits have expanded by more than half, with margins at multi-decade highs. Yet Japanese companies, relative to earnings, are no more expensive than they were during the doldrums of the early 2000s. Moreover, they have rarely been cheaper relative to their American counterparts. (The ideal time to buy, by this simplistic analysis, would have been the middle of 2016.)

Source: US stocks too expensive? Consider Japan, FT Alphaville

Lawrence Hamtil at Fortune Financial wrote a thorough article on the reasons for the cheap valuation of Japanese stocks. From the article:

For much of the last 25 years, Japanese equities have delivered subpar returns relative to the broader global equity markets:

In fact, from January of 1992 through February of this year, the Dow Jones Japan Total Return index has returned only 1.7% annualized, versus roughly 7.5% for the Dow Jones Global Total Market index.

It is true that a main culprit for this lackluster performance was that by the start of the 1990s, Japan had become one of the largest – if not the largest – equity bubbles of all time. For those who were not alive then, it may be difficult to imagine that by the early 1990s, Japan accounted for some 40% of the global equity market, versus only about 30% for the United States, according to data from Credit Suisse.

One would think that after such a long period of anemic returns that Japanese equities would be bargain-priced relative to the developed world, but, on the surface, that doesn’t appear to be the case:

However, in the case of Japan, valuation analysis must take into account the enormous cash piles on which Japanese corporations are sitting.

Source: Japanese Stocks Are Cheap, But Will It Matter?,  by: Lawrence Hamtil  , Fortune Financial

In an opinion piece in Money Observer Mitesh Patel, assistant fund manager on the Jupiter Japan Income fund of UK is cautiously bullish on Japan. From the piece:

As recently as 2013 nearly 600 of the 1,400 largest listed companies in Japan had no outside directors at all. Not only does this compare unfavourably to other large developed markets, but even less established markets like South Korea, China and India are all way ahead of Japan in this regard.

Even where outside directors were present they were often far from independent and frequently tame: unable or unwilling to hold management to account. For minority shareholders – those with no direct board representation of their own – this is a huge problem, allowing management to behave with little consideration for their best interests.

The detachment of management from shareholders in Japan has been exacerbated by the timing of AGMs: in 1995 some 96 per cent of all AGMs were held on the same day (it is now just 32 per cent). The reason for this was to combat sokaia – racketeers specialising in the extortion of companies by the threat of public humiliation at AGMs.

The immediate effect, however, was to drive a further wedge between management and shareholders. The association made between tough questioning by shareholders and some degree of impropriety lingers in too many boardrooms.

Management compensation has been a further stumbling block. Not only are Japanese executives poorly paid, but also very little of their compensation depends upon their performance compared with US or UK executives. This has led to a management class with few incentives to do better. It has also meant that Japanese companies have typically been unable or unwilling to hire the best foreign managers for top jobs.

Company managements aren’t entirely to blame, however. For too long too many shareholders have been accepting of poor management behaviour, automatically voting in line with management or not voting at all. One of the key reasons behind this is that many shareholders are not investors at all, but rather hold shares for ‘commercial’ reasons.

The result?

Japanese management teams have been too cautious to pay out a fair share of the profits their companies make and too keen to hoard cash. This timidity, combined with a general disinterest in profit maximisation has led to sub-par returns for Japanese businesses versus their global peers. Over the last 20 years return on equity has averaged just 4.7 per cent for Japan against 13.4 per cent for the US, 10.1 per cent for the UK and 8.8 per cent for Germany.

Source: Japan is learning to love its shareholders, Money Observer

The key takeaway is that stocks in Japan are cheap for a reason. Companies there have failed investors repeatedly in the past. Though the country is very advanced and the economy is one of the largest in the world, global investors are better of staying out of Japanese stocks. This is true especially for long-term investors.


Comparing Military Power of Select East Asian Countries

The graphic below shows the military power of China, North Korea, South Korea and Japan. North Korea has a population of 24 million and an active military force of about 1.2 million.  China which has a population of over 1.3 billion has just 2.2 million active military personnel. North Korea has a strong military since the country focuses on defense then civilian economy. As a result, its military is strong but perennially has economic woes and civilians suffer even to access basic necessities such as food.  On the other hand, in a perverse sense its strong military also ensures hostilities do not break out shattering the fragile peace now holding in the region for many decades.

Click to enlarge

Source: North Korea crisis: Which country has the strongest military in the region?, Deutsche Welle

Monthly Real S&P 500 Price from 1881 thru March 2017: Chart

The S&P 500 closed at 2,402.32 on price basis today. Year-to-date the index is up a decent 7.30%. In the past 10 years it has grown by 4.81%. Over the long run the index has beat inflation. The Monthly Real Return of S&P 500 from 1881 thru March, 2017 is shown below:

Click to enlarge


Source: Keep calm and carry on, Retirement Investing Today

Though it is very rare for investors to hold stocks over 100 years,  the above chart shows that in the long-run the US market as measured by the benchmark S&P 500 goes higher.

Related ETF:

  • SPDR S&P 500 ETF (SPY)

Disclosure: No Positions