The Top 10 Economies of the World in 1970 vs. 2017: Chart

The 20th century belonged to the US and is known as the “American Century”. The 21st century is projected to be the “Asian Century” as countries such as China and India rise as world’s leading powers although economically and not militarily. Already these two countries have joined the list of the world’s top 10 economies as shown in the chart below. In 1970, neither of them were in the list. Spain which used to be the world’s wealthiest country in the 16th century and Russia were replaced by China and India.

Click to enlarge


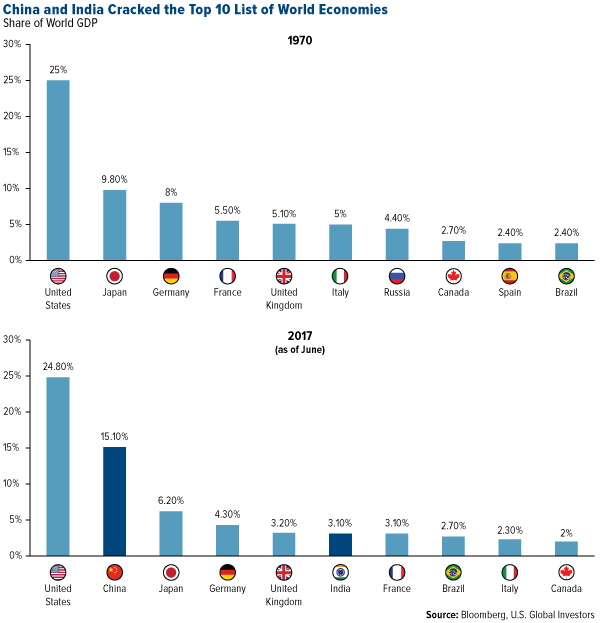
Source: One Easy Way to Invest in the “Asian Century” by Frank Holmes, US Funds

Total Returns During US Equity Secular Bull and Bear Markets Since 1877

The US equity market is currently in a secular bull market. In a secular bull market stocks keep going up and up until the party ends. Secular bull markets are of course followed by secular bear markets where stocks go nowhere for years. For instance, the first decade of the 21st century was “The Lost Decade” for US stocks when stocks ended up earning nothing excluding dividends.

The difference in total returns between bull and bear markets can be quite dramatic according to an article by Niels Clemen Jensen at Absolute Return Partners, UK. From the article:

Another example is the wider performance of equity markets. At the very highest level, I divide equity markets into secular bull and secular bear markets. Over the last 150 years or so, the US has enjoyed six secular bull markets and only five secular bear markets (exhibit 2).

A secular bull market is characterised by rising earnings multiples, whereas earnings multiples decline in secular bear markets. Falling earnings multiples lead to the sharply lower returns that characterise secular bear markets. As you can see, the difference in total returns between secular bull and bear markets is quite dramatic.

Exhibit 2: Secular US equity bull and bear markets since 1877
Source: Jill Mislinski, Advisor Perspectives, March 2017, www.advisorperspectives.com

Source: May 2017- Investment Rules, The Absolute Return Letter, Absolute Return Partners

The average time for the S&P 500 since the 1960s from peak to trough and then to recover to its peak has been around four years according to article by Rob Williams at Schwab. So investors have to have the patience to wait it out in case they get caught in bear markets.

Click to enlarge

Source: Market Volatility: What If You Don’t Have Time to Recover?, Schwab

Related ETFs:

  • SPDR S&P 500 ETF (SPY)

Disclosure: No Positions

Also checkout: Length of Bear Markets Since 1920s, TFS

Comparing the Dividend Yield of Select Asian Equity Markets

Singapore’s has the highest dividend yield among Asian markets. The dividend yield of 3.7% based on the FTSE index for Singapore is the highest relative to other countries in Asia as shown in the chart below:

Click to enlarge


Source: Singapore’s High Dividend Yields Grab Spotlight Again,SGX

Of the countries shown above, India has the lowest dividend yield.

None of the Singapore firms trade on the US exchanges. However investors willing to add Singapore stocks have plenty of options on the OTC market. Some of the stocks that investors can consider for further research are: DBS Group( DBSDY), United Overseas Bank(UOVEY), Singapore Airlines (SINGY), etc.

The complete list of Singapore ADRs can be found here.

Disclosure: No Positions